
In 2014, we published an article titled “Challenges Confronting US Retail Properties,” in which we outlined the major challenges confronting retail properties and voiced concern about the health of the sector.[1]
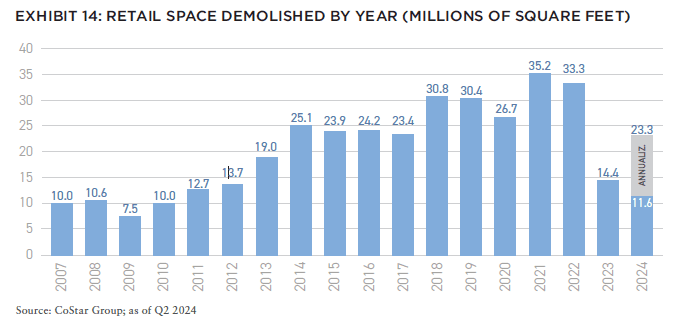
During the subsequent period the sector continued to exhibit weakness and many retail facilities became redundant or obsolete. Delinquency rates have remained elevated for most of that time period. In response to this weakness, the level of new construction decreased substantially, and more than 280 million square feet of space was demolished over the past decade. As a result, retail vacancy rates are lower now than they were pre-COVID (the only major sector of which that can be said).
In the future, more obsolete retail space is expected to be destroyed or repurposed. The sector appears to be getting closer to recalibration based on the combination of reduced construction and demolitions. Nevertheless, nearly every retail property in America competes with Amazon (and other online retailers).
In urban areas, retail rents differ from block, mid-block, and corner; and in suburban and exurban areas, rents differ by favorable/unfavorable intersection, and curb-cut to curb-cut. It is perhaps the most location-specific property type because visual exposure, access, and pedestrian and vehicular traffic patterns impact desirability to a granular extreme.
While each retail property has unique characteristics and involves very targeted investment decision-making, the sector is impacted by metro area supply and demand characteristics as well as national economic considerations. On the market level, factors like population growth, household income growth, and retail per capita impact potential performance in the retail sector. On the national macro level, the health of the economy, wages, savings, and retail sales impact the sector.
We begin our discussion on the macroeconomic level.
STAGNANT WAGE GROWTH AND EXHAUSTION OF COVID-ERA SAVINGS
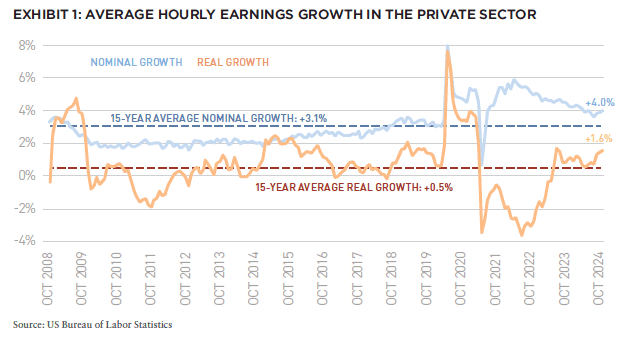
Stagnant wage growth and the exhaustion of excess savings derived from COVID-era fiscal stimulus could pressure retail sales in the future. Over the past fifteen years, annual wage growth (nominal) has averaged 3.1%, only slightly outstripped average annual inflation over that period, resulting in real average wage growth of just 0.5% annually over the past 15 years.
As of October 2024, real wage growth of 1.6% YOY is an improvement, but it comes on the heels of nearly two years of high inflation and negative real wage growth. Since the pandemic began, inflation-adjusted wages are up a cumulative 2.3% over that four-and-a-half-year period. Workers who have experienced wage growth that has barely kept up with inflation may be forced to reduce discretionary spending in order to pay for necessities.
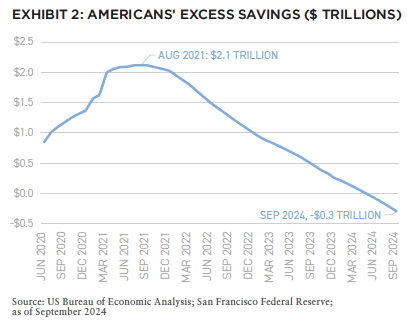
Americans’ excess savings climbed to a high of nearly $2.1 trillion in August 2021, boosted by a combination of fiscal stimulus and inability to spend on services during the pandemic. However, this has now been exhausted, and the level of Americans’ savings is below the level prior to the beginning of the COVID response, according to the San Francisco Federal Reserve.
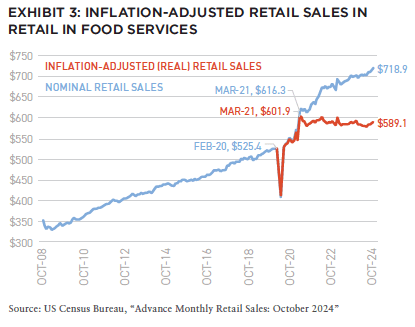
Retail sales on a nominal basis are up 2.8% YOY as of October 2024. However, real retail sales are up 0.3% YOY. Similarly, from March 2021, nominal retail sales are up 17%, while real retail sales are down—2% over the same period. This stagnation in real retail sales demonstrates that consumer spending may not be as strong as headline nominal retail sales would imply.
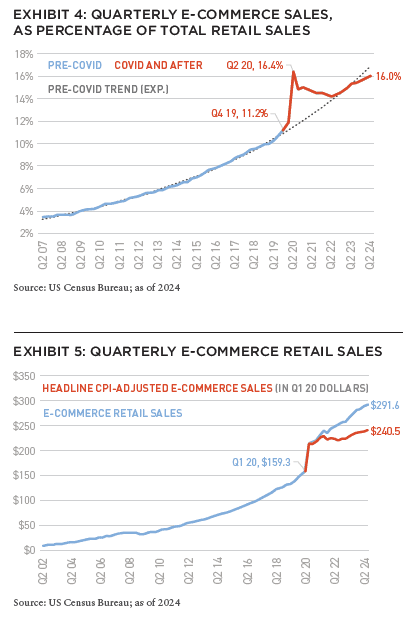
Every retail property in America competes with a virtual mall situated in the palm of each American’s hand. This comes in the form of Amazon as well as other online retailers. E-commerce as a share of total sales increased from 15.8% in Q1 2024 to 16.0% in Q2 2024. The growth in e-commerce sales has slowed in both nominal and real terms, from 8.1% and 4.6% YOY in Q1 2024, down to 6.7% and 3.7% YOY in Q2 2024, respectively. Not dissimilar from retail sales, e-commerce sales were up 83.1% on a nominal since 1Q2020, however, real e-commerce sales were up 51% over the same period.
CRE RETAIL FUNDAMENTALS
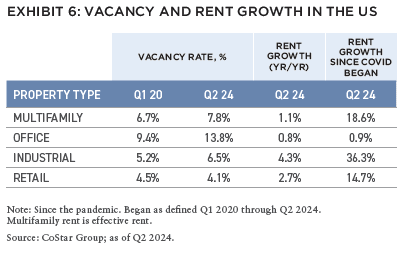
In terms of occupancy level, retail has been the best-performing major property type since the beginning of the pandemic. Among the four major property types, it is the only one with a vacancy rate lower than it was pre-COVID. A major factor in this good performance has been the nominal new construction that has entered the market since pre-COVID. Apart from industrial, retail asking rent growth has outstripped the other property types over the past year as of 2Q2024.
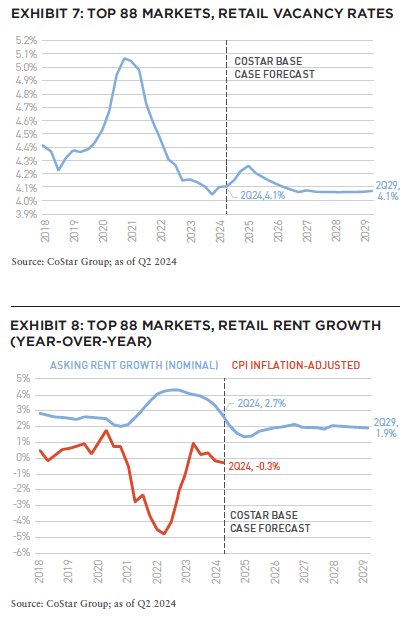
Forecasts project the very-low level of construction to continue, and for supply and demand to remain largely neutral, resulting in similar vacancy rates over the next five years. Asking rents, which have grown 2.7% YOY on a nominal basis, are projected to have only modest rent increases of about 2% annually over the next five years.
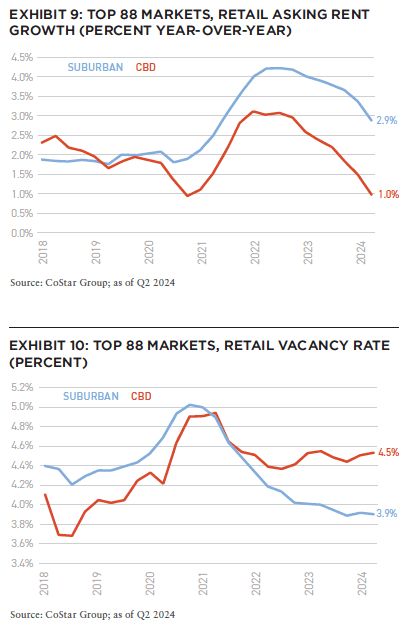
Demand for urban retail has been weakened by less daytime foot traffic in certain urban cores stemming from remote work. Conversely, suburban neighborhood centers are seeing some of the benefits from remote work, and we expect this dynamic to continue. Prior to 2019, urban retail experienced lower vacancy rates and greater rent growth relative to suburban locations. Since COVID, this trend has reversed. As of Q2 2024, the retail vacancy rates in central business districts (CBDs) and suburban locations were 4.5% and 3.9%, respectively. Likewise, suburban retail asking rent growth of 2.9% YOY outstrips 1.0% YOY growth for retail properties in CBD locations.
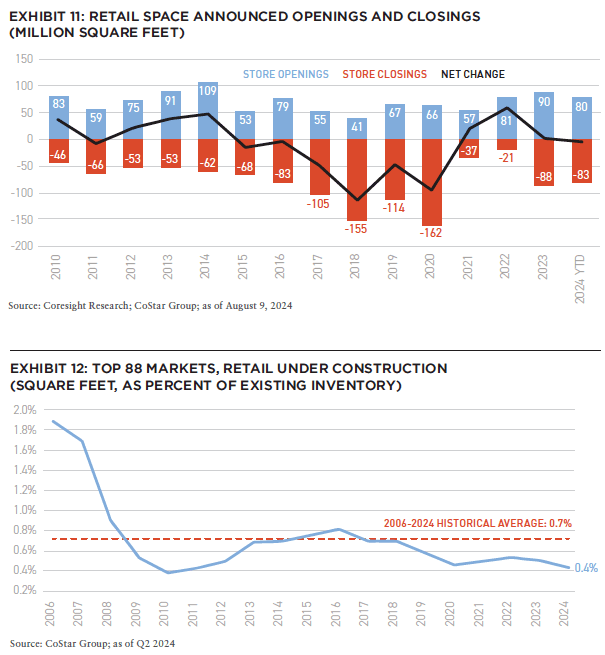
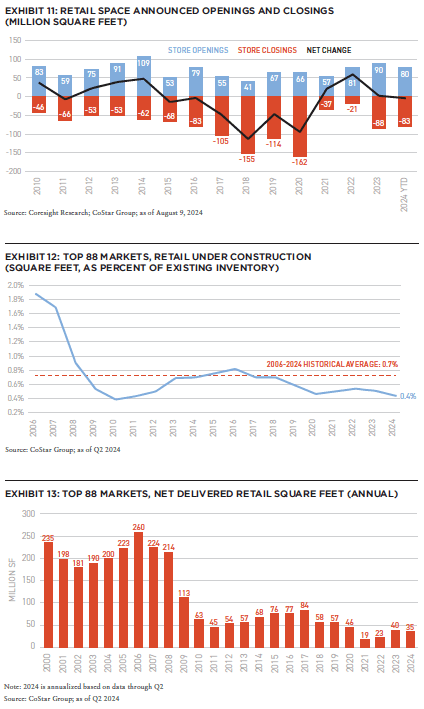
In 2024 year-to-date, retail store openings are down slightly on a net basis. Over the previous three years, store openings have outpaced closures, which was a shift from before COVID, when closures significantly outpaced openings between 2015 and 2020.
The level of retail space currently under construction stands at just 0.4% of existing inventory, which is below average over the past 18 years of 0.7%. In the years prior to the Global Financial Crisis (GFC), an average 214 million square feet of retail space was delivered annually in the US Since the GFC (from 2009 to 2024), the average has fallen to 57 million square feet. Retail new supply hit a record low in 2021 during the COVID pandemic.
Although the level of gross retail construction remains low by historical standards, another factor leading to the low level of net retail construction is the demolished retail space across the US. Over the past four and a half years, 122 million square feet have been removed from inventory, and 280 million square feet over the past decade.
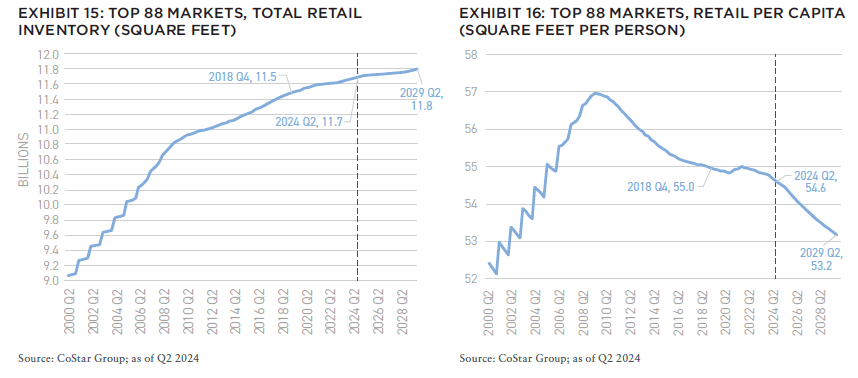
Total retail inventory has grown at an anemic rate over the past fifteen years. This is the result of little new construction and the demolishment and reimagining of some existing space. However, considering that the US population has grown over the same time period, the per capita retail space has plummeted at a significant rate.
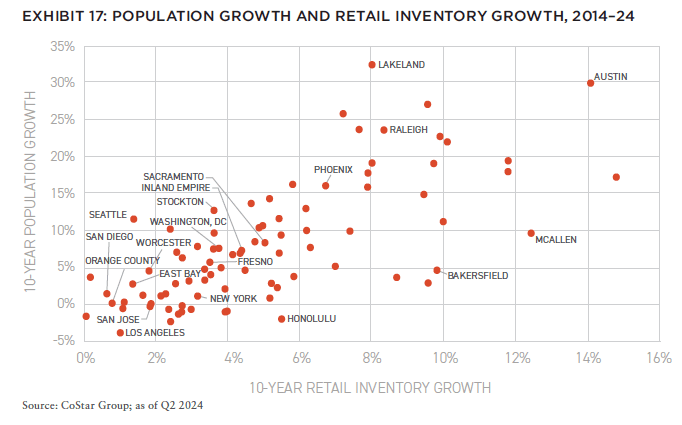
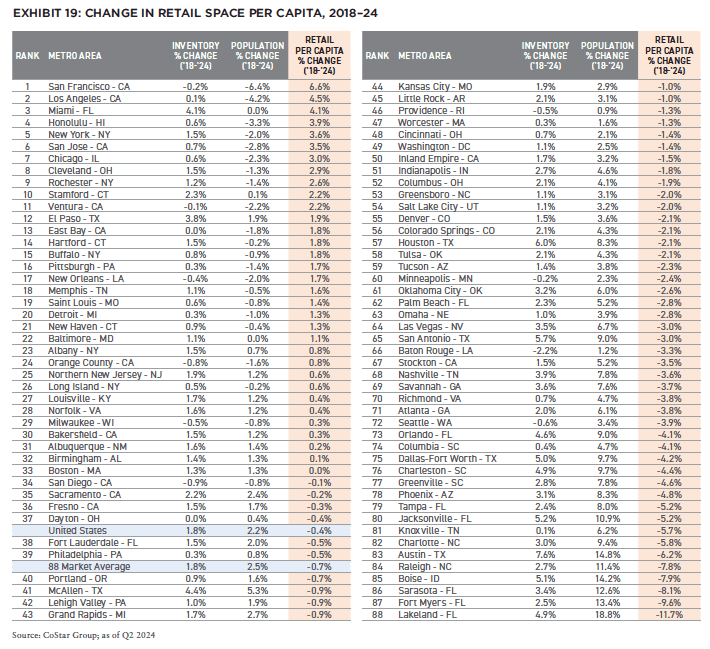
Over the past decade, the rate of population growth has outpaced the rate of retail inventory growth in fifty-five of the top eighty-eight markets. Of markets with population growth greater than 22% over this period, only Austin had retail inventory growth that surpassed 10%. Generally, metro areas above the black line could represent retail markets that are less at risk of oversupply.
OVERBUILT RETAIL, NOT EVENLY DISTRIBUTED
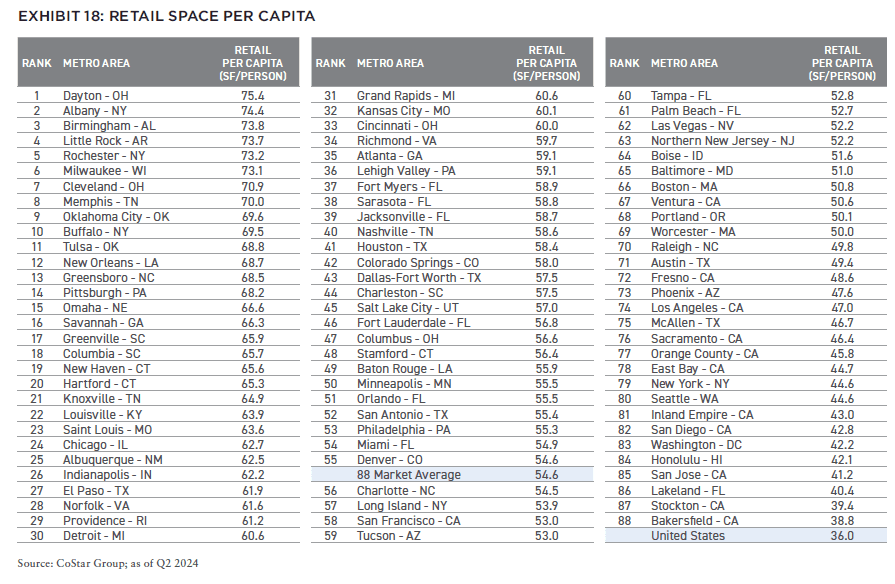
The US retail market is still widely considered overbuilt. According to the International Council of Shopping Centers (ICSC),[2] the US has twenty-four square feet of shopping center and mall retail per capita, significantly more than Canada (17), Australia (11), U.K. (5), France (4), China (3), and Germany (2). When all retail is considered, the US has thirty-six square feet per capita, compared to 19.5 in the UK, according to CoStar.[3] However, this overcapacity is not evenly distributed.
In this section, we examine which parts of the US are most oversupplied.[4] The oversupply is particularly relevant considering that retail is also challenged by relatively stagnant wage growth and e-commerce.
There are two components to retail space per capita change; 1) population change, and 2) retail inventory levels.
Overbuilt retail markets in the US tend to be concentrated in areas that have experienced stagnant to declining population change. In general, these markets include features of post-industrial economies. In the period from 2000 to 2024, the US population grew 19.4%, while markets with high retail per capita grew slower or declined, like Dayton (population growth of +0.9%), Rochester, NY (+0.8%), Milwaukee (+3.9%), Cleveland (-4.1%), Buffalo (-1.6%), New Orleans (-7.0%), Pittsburgh (-4.0%), New Haven (+4.7%), and Hartford (+5.5%). Growth in retail inventory (even if moderate) coupled with anemic or declining population has resulted in high retail per capita in these markets.
The pandemic was also a catalyst for migration. In the period from 2018 to 2024, the US population grew 2.2%, while some markets with high retail per capita saw population growth which was slower or declined, like Dayton (+0.4%), Albany (+0.7%), Birmingham (+1.3%), Rochester, NY (-1.4%), Milwaukee (-0.8%), Cleveland (-1.3%), Memphis (-0.5%), and Buffalo (-0.9%). In fact, eight of the ten markets with the highest retail per capita also had population growth below the national average over both the 2000–24 and 2018–24 time periods.
Oklahoma City and Memphis had two of the top ten retail per capita figures in 2024. This is due to being two large US metro areas in terms of geographic area relative to their population, at 5,500 and 4,600 square miles, respectively.[5] This results in relatively lower population density. Since the population is spread out over a large land area, more retail is required. Since 2018, Oklahoma City has benefitted from population growth, and now ranks ninth, down from sixth in 2018. Memphis did not benefit from population growth and now has a higher retail per capita, currently ranked eighth, up from twelfth in 2018.
Metros with some of the lowest retail per capita are large metro areas such as Washington, D.C., Seattle, New York, and Los Angeles. In the age of e-commerce, low retail per capita does not necessarily translate into sustained low vacancy rates. Manhattan’s retail vacancy and availability rates have climbed from 3.4% and 5.1% in 4Q2018 to 5.1% and 6.5% as of Q2 2024, despite its relatively light retail footprint, economic prosperity, and near record-setting tourism levels. However, Manhattan has suffered a 3.6% population decline since pre-COVID and online prices are substantially lower than high priced Manhattan retailers can offer.[6]
In addition, many Manhattan landlords are financially squeezed by large mortgages and may be postponing leasing in the hope of signing a high-end restaurant chain or a bank branch. Post-pandemic, remote work, less urban foot traffic, increased crime, and homelessness have negatively impacted urban retail in many locations in the US, including Manhattan.
California metros also dominate the bottom of the list. The low per capita retail may be due to the large, concentrated population centers in the state and, perhaps, some retailers being reluctant to locate or remain in some of the higher-crime, very-high-density areas of Los Angeles. Barriers to entry, including topography, anti-growth politics, and the infill nature of a built-out environment probably contribute to the relatively light retail footprint. The Inland Empire has a relatively concentrated population for suburban areas.
CHANGE IN RETAIL SPACE PER CAPITA SINCE COVID
As noted, there are two components to retail space per capita change; 1) population change, and 2) retail inventory levels. The pandemic caused accelerated migration around the US from expensive coastal metros to lower cost/tax areas in the sunbelt and intermountain west. This resulted in more excess retail space in areas that lost population and less space per capita in fast growing parts of the US Most of the increase per capita resulted from increasing or declining populations, however, there are several examples of increased inventory being the cause. Although Miami, recorded almost no population change between 2018 and 2024, its retail inventory increased 4.1% compared to 1.8% for the US Austin recorded the greatest inventory increase at 7.6%, but it was outstripped by population growth of 14.8%. Likewise, other fast-growing areas like Houston, San Antonio, Jacksonville, Boise, Dallas, Charleston, Lakeland, and Orlando added retail space but not nearly at the rate of population increases. Despite retail inventory growth, major markets like Raleigh, Austin, Charlotte, Jacksonville, Tampa, and Phoenix have a low retail per capita relative to other major markets.
Conversely, migratory trends away from more expensive coastal markets, which accelerated during COVID, caused retail per capita to rise in these markets. San Francisco moved up from ranking 71st to 58th highest retail per capita in the nation. Similarly, Los Angeles was up from 79th to 74th rank, New York (82nd to 79th), and San Jose (87th to 85th). Although rising retail per capita due to population loss is a particular challenge for these markets, retail precision-investing strategies still apply.[7]
Many post-industrial markets, which have experienced stagnating and declining population over the past 20 years, continue to become even more overbuilt due to continued outmigration. Chicago went from rank 35th to 24th, Cleveland from 11th to 7th, Rochester, NY from 7th to 5th, Buffalo from 17th to 10th and Pittsburgh from 19th to 14th, Detroit from 41st to 30th.
Border metros such as El Paso, McAllen, Laredo, and Buffalo service international shoppers from Mexico or Canada and thus justify higher retail per capita.
BUYING POWER
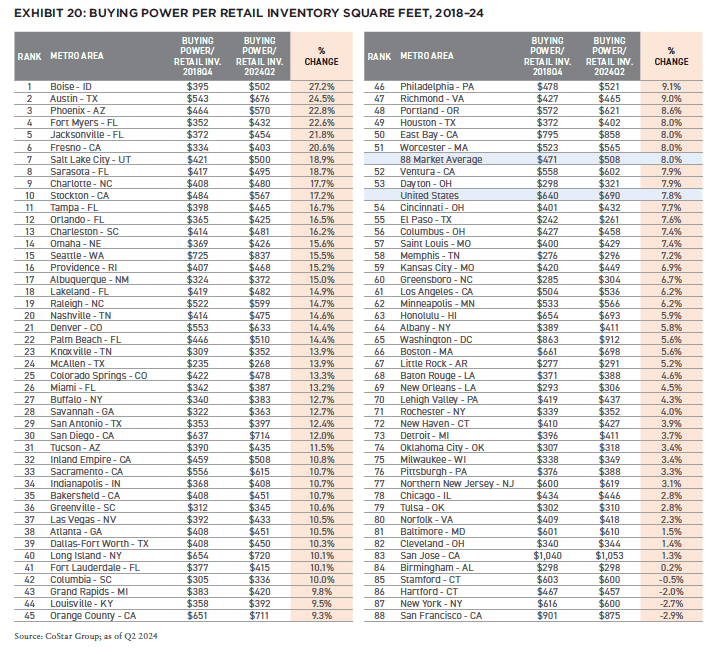
Another way of looking at retail supply is by comparing the product of the number of households and the real median household income (Buying Power). Buying Power is then observed on a per retail square foot basis.
Markets that have experienced the greatest growth in “buying power per retail square foot” include those with both fast-growing populations and median incomes, where retail construction has not kept up. This includes Boise (27.2%), Austin (24.5%), Phoenix (22.8%), Fort Myers (22.6%), and Jacksonville (21.8%). Many of these markets were bolstered not only by population growth, but also by median household income growth as well.
There are four markets which saw a decline in this metric, San Francisco (-2.9%), New York (-2.7%), Hartford (-2.0%), Stamford (-0.5%). Although real median household income rose in these markets, severe population losses offset this benefit. Other markets with below-average growth in “buying power per retail square foot” are markets in the Midwest, such as Cleveland (1.4%), Chicago (2.8%), Pittsburgh (3.3%), Milwaukee (3.4%), and Detroit (3.7%), which were adversely impacted by both sluggish income growth and slow-to-declining population growth.
THE FUTURE OF RETAIL
Retail has gone from being the weakest asset class to a promising one due to modest inventory growth and the elimination of redundant space. Opportunities abound in growing markets in which retail has not yet caught up with an increasing population. This includes markets with low retail per capita like Raleigh, Austin, Charlotte, Jacksonville, Tampa, and Phoenix.
Increased buying power due to both household growth and median income growth bolster these markets. Additionally, overbuilding in retail in these markets may be less likely because the impact of e-commerce on retail space is more well known. Areas with barriers to building and reduced prices may afford good investment opportunities. Suburban retail has benefitted from remote work, has outperformed, and offers good investment prospects, especially in growing areas with barriers to retail building. Some have found success redeveloping existing redundant retail facilities into other uses.
NEW: SUMMIT #17

+ EDITOR’S NOTE
+ ALL ARTICLES
+ PAST ISSUES
+ LEADERSHIP
+ POLICIES
+ GUIDELINES
+ MEDIA KIT
+ CONTACT
WHERE ARE WE IN THE CYCLE?: OVERVIEW OF THE US ECONOMY AND REAL ESTATE SECTOR
Richard Barkham + Jacob Cottrell | CBRE
COMPELLING OPPORTUNITIES: MAKING A CASE FOR US REAL ESTATE
Karen Martinus + Mark Fitzgerald + Max von Below | Affinius Capital
OPEN WINDOW: WHY NOW IS THE TIME TO INVEST IN COMMERCIAL REAL ESTATE
Chad Tredway + Josh Myerberg + Luigi Cerreta | JPMAM
NORMALIZING MOVEMENT: POPULATION MOVEMENTS NORMALIZING AFTER COVID-19 SHOCK
Martha Peyton + Matthew Soffair | LGIM America
CHRONIC SHORTAGE: THE US HOUSING SCARCITY WILL BE LIKELY TO PERSIST FOR SEVERAL YEARS
Gleb Nechayev | Berkshire Residential Investments
FLORIDA FOCUS: PRODUCTION INDEX BELOW 50 CURIOUSLY SIGNALS OPPORTUNITY
Rafael Aregger | Empira Group
WHOLESALE CHANGE: DEMOGRAPHIC CHANGES AND STAGNANT INVENTORY CREATE NEW OPPORTUNITIES FOR RETAIL
Stewart Rubin + Dakota Firenze | New York Life Real Estate Investors
GAME CHANGE: INFRASTRUCTURE GROWTH ACCELERATING WITH AI
Jon Treitel | CBRE Investment Management
FOR THE TREES: MASS TIMBER INTEGRATION IN INDUSTRIAL REAL ESTATE
Mary Ellen Aronow + Erin Patterson + Caroline Suarez + Cassidy Toth | Manulife Investment Management
BORDER INDUSTRIAL: INVESTING IN US/MEXICO BORDER PORT INDUSTRIAL MARKETS
Dags Chen, CFA + Lincoln Janes, CFA | Barings Real Estate
RESILIENCE AMIDST UNCERTAINTY: HOW ISRAELI AND UKRAINIAN INVESTORS ARE ADAPTING REAL ESTATE STRATEGIES DURING CONFLICT
Asaf Rosenheim | Profimex
CYBER RISK VIGILANCE: HOW REAL ESTATE DIRECTORS AND BOARDS CAN GUARD AGAINST CYBER RISK
Marie-Noëlle Brisson, FRICS, MAI + Michael Savoie, PhD | CyberReady, LLC
ALTERNATE REALTY: DIGITAL RIGHTS MANAGEMENT FOR REAL ESTATE AND AUGMENTED REALITY
Neil Mandt | Digital Rights Management + Steve Weikal | MIT Center for Real Estate
DRIVING FORCE: UNDERSTANDING SYNDICATED LOANS AND MULTI-TIERED FINANCING
Gary A. Goodman + Gregory Fennell + Jon E. Linder | Dentons
HOUSING COMPLEX: CUTTING-EDGE APARTMENTS ARE A CATALYST FOR A MORE PROFITABLE FUTURE
Alejandro Dabdoub | AOG Living
NOTES
1. Rubin, Stewart. “Challenges Confronting US Retail Properties.” CREFC Finance World (Summer 2014). Other Strategy & Research Group articles on the topic of retail include: Rubin, Stewart. “Challenges Confronting Regional Malls Intensify.” IRE Americas (September 2017); Rubin, Stewart. “Overbuilt Retail – Not Evenly Distributed.” (December 2018).
2. Based on 2018 data. More update data was not available.
3. Source: CoStar Group. Data for other nations is not available.
4. “All Retail” is used for the metro-by-metro analysis in this whitepaper.
5. With over 500,000 people. Source: US Census Bureau
6. E-Commerce is particularly attractive in New York City since prices are very high to pay for expensive rent and labor.
7. That is to say, investing in promising targeted areas within a metro that has less attractive fundamentals.
ABOUT THE AUTHORS
Stewart Rubin is Senior Director and Head of Strategy and Research, and Dakota Firenze is a Senior Associate, for New York Life Real Estate Investors, a division of NYL Investors LLC, a wholly-owned subsidiary of New York Life Insurance Company.
THIS ISSUE OF SUMMIT JOURNAL IS GENEROUSLY SPONSORED BY
/ EXECUTIVE SPONSOR
AOG Living is a leading fully integrated, multifamily real estate investment, construction, and property management firm headquartered in Houston, Texas. AOG Living has acquired, built, or developed more than 20,000 multifamily units with a total aggregate value of over $2.4 billion and has a growing portfolio of more than 35,000 apartment homes and 170+ properties under management throughout the nation. Learn more at aogliving.com.
/ ASSOCIATE SPONSOR

Vertically integrated owner, operator, and developer of Sunbelt multifamily. Partnering with institutions on a single-asset and programmatic basis. 28k+ units acquired and developed. 62k+ units under management. 1,500+ associates. 8 Sunbelt states. To learn more, visit hrpinvestments.com and hrpliving.com. And for more information, contact john.duckett@hrpliving.com.
/ SUPPORTING SPONSOR
Affinius Capital is an integrated institutional real estate investment firm focused on value-creation and income generation. With a 40-year track record and $64 billion in gross assets under management, Affinius has a diversified portfolio across North America and Europe providing both equity and credit to its trusted partners and on behalf of its institutional clients globally. To learn more, visit affiniuscapital.com.