
As of summer 2024—and despite its relatively nascent existence as an institutional property type—the US single-family housing market is the largest, oldest, and most diversified real estate sector in the world.
Like other property types, we believe the single-family rental (SFR) sector has limited correlation to broader markets, while potentially serving as a valuable source of inflationary protection.1, 2 However, SFR is distinct from other property types because it can provide enhanced liquidity and price transparency through its robust owner-occupied market, as well as offering an ability to create a portfolio with increased diversification by unit count and geography.
With these distinctions in mind, this article provides a comprehensive overview of the current SFR sector and highlights its distinct features compared to other more conventional real estate asset types.
LARGEST AND MOST DIVERSE REAL ESTATE SECTOR IN THE WORLD
The $36 trillion size of the US single-family market3 surpasses all other institutionally managed US commercial real estate, which totals $13 trillion unlevered on a combined basis.4 The SFR sector continues to provide an opportunity for diverse exposure to assets across geography (i.e., physical location/submarket), unit count, and tenants, limiting the potential idiosyncratic asset-level risks common in more traditional commercial real estate property sectors. Despite these attributes, the sector remains underinvested from an institutional perspective, with institutional ownership accounting for less than 3%.5
STABLE ASSET RETURNS THROUGH TIME
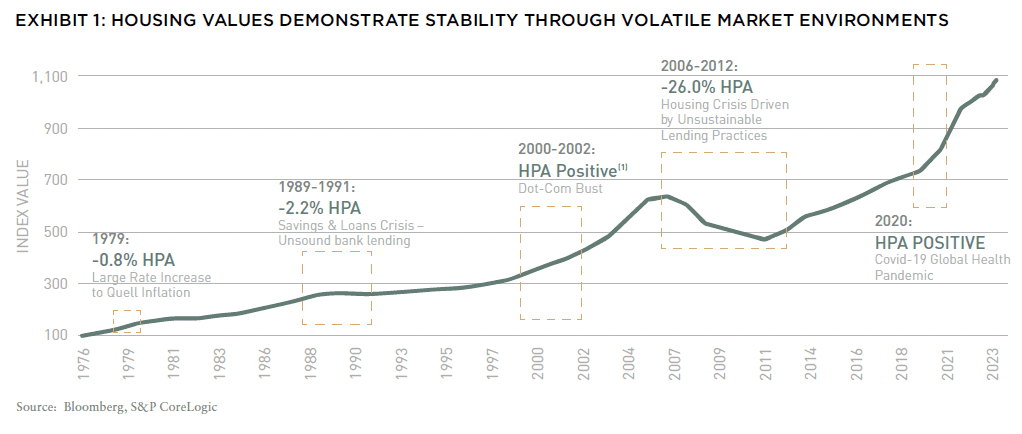
One common misconception is that the US housing market moves with spectacular volatility. Investors often immediately look to the GFC or the run-up in pricing following COVID. To inform these views, while housing during those time periods did exhibit dramatic changes in values (as did many other asset classes), it’s important to look at the market across many decades to put that volatility in context. With this lens, we see that the US housing market (and SFR as an asset class) has been relatively stable over time.
When examining home price data over the last 50 years, a key takeaway is that housing values have exhibited an average annual increase of 5.5%, and have performed relatively well in moderate recessions (Exhibit 1). During this time, there have only been three periods where housing prices decreased over a one-year horizon: (1) the hyper-inflationary period in the 1970s; (2) the Savings & Loan Crisis of the 1980s and 1990s; and (3) the GFC.6
While housing has performed well on a relative basis to other asset classes during these recessionary periods and others, industry watchers often question if there is risk of another housing crisis like the GFC where there could be a significant value decline in housing. Since the GFC, the housing market has undergone a wave of regulation, which has likely re-set the playing field and provided a much more fundamentally sound backdrop relative to the GFC. Mortgage origination has predominantly targeted conservatively underwritten borrowers, with higher credit scores and thirty-year fixed rate mortgages. It is also worth noting that the average existing mortgage in the US has a rate of 3.8%, which is well below today’s headline mortgage rate (around 7%).7, 8 Additionally, the housing market has seen a record buildup of equity with the average LTV at 28%.9
This has arguably established a stable foundation for the housing market—a stark contrast to the events preceding the GFC. In 2008, a housing bubble emerged due to a confluence of factors, resulting in a scenario marked by underwater mortgages and distressed selling. Today, we believe the prevailing challenge confronting the housing market is not delinquencies or distressed sales, but rather, affordability and lack of supply.
US HOUSING MARKET UPDATE
Structural Drivers Creating Long Term Value: US Housing Shortage
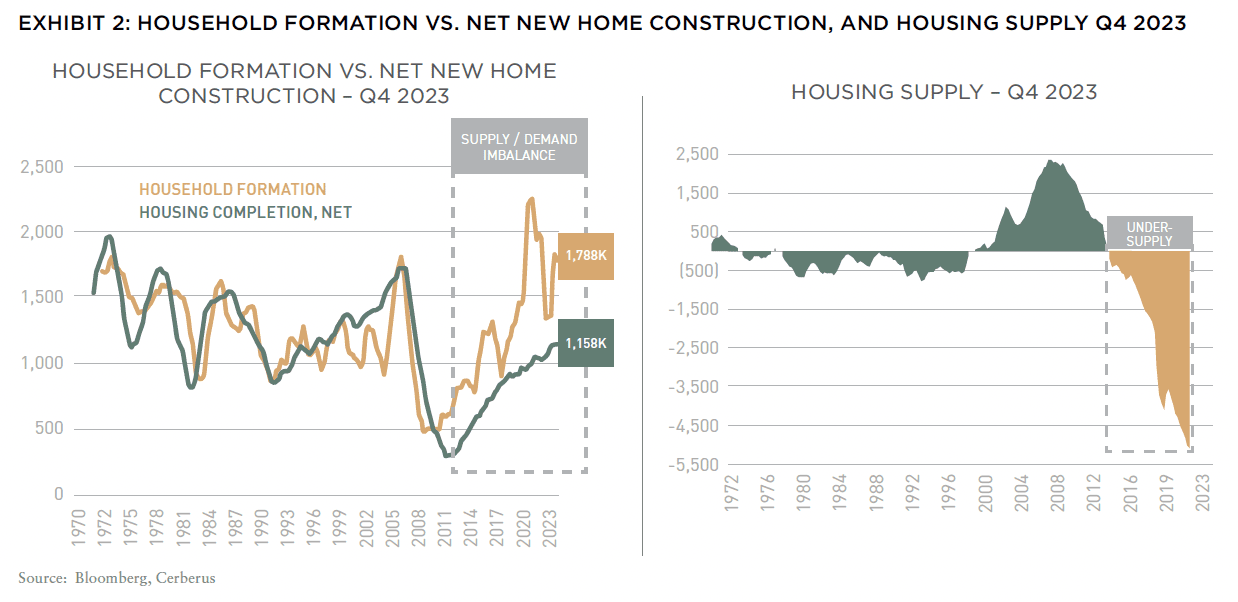
When evaluating historical data, there has been an observable trend where household formation has consistently exceeded new construction by around 600,000 units per year for more than a decade.10 This has resulted in an approximate shortage of between three and five million homes available for sale, with little improvement over time.
Paradoxically, the recent increase in interest rates, while reducing demand, has compounded the shortage by dampening new construction and discouraging existing homeowners from putting their homes on the market, stemming from a desire to retain their historically low long-term fixed mortgage rates. This “mortgage lock-in” effect is a significant contributing factor to the 75% decrease in existing home sales from their peak level.8, 11
Beyond the overall shortage, it is critical to evaluate demand relative to supply by considering months of supply. A balanced market generally offers five or six months of supply, while a tight market has less than five months of supply.12 As of Q1 2024, we continue to see lower than average months of supply of 3.2 months for existing homes, which typically supports home price appreciation and stands significantly below its long-term average.13 While new construction months of supply is at 8.3, this is only a small part of the market (roughly 15%) and this has dropped from its peak of 10.1 months in July 2022.14
Population Growth
Population growth tends to be another large driver of home prices. We anticipate that this demographic trend in specific growth markets will continue to contribute to the regional and nationwide housing shortage. Provided that market headwinds related to affordability diminish, the combination of low months of supply, the pervasive shortage, and sustained population growth will likely drive housing values for years to come.
Single-Family Rental Compared to Multifamily For several decades, multifamily properties have been a material component of institutional real estate portfolios. While there are many advantages associated with investing in multifamily and other forms of rental housing in general, we also contend that SFR can possess potential additional positive attributes when compared to multifamily, including (1) enhanced liquidity and price transparency via the owner-occupied market; (2) favorable structural supply trends; and (3) typically, a more stable tenant.
ENHANCED LIQUIDITY IN SINGLE FAMILY
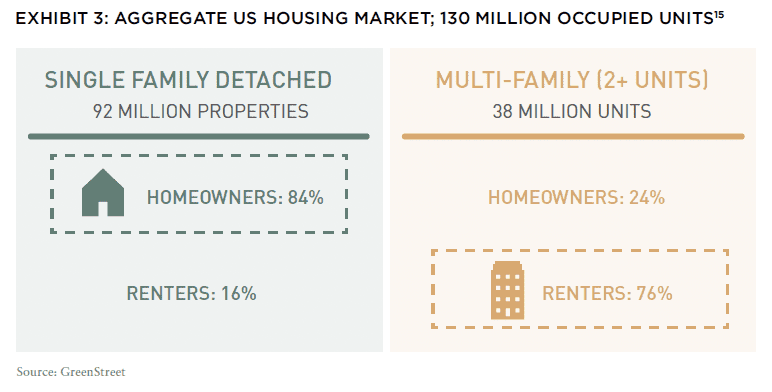
The US “housing market” is generally comprised of single-family homes, townhomes, condos, and manufactured housing (with single-family homes representing the largest share). Approximately 16% of single-family detached homes are owned by investors and rented, while 84% of the market is owner-occupied.15 Conversely, multifamily is 24% owner occupied and 76% institutionally owned and rented (Exhibit 3).15
We believe this dichotomy of owners and renters in single-family is a critical and often overlooked characteristic that distinguishes SFR not only from multifamily, but most other real estate property types. The owner-occupied nature of single-family detached housing has created a market where a statistically significant number of homes transact (six million across the US on average), in contrast to multifamily properties, which experience much more limited transaction volumes.16, 17
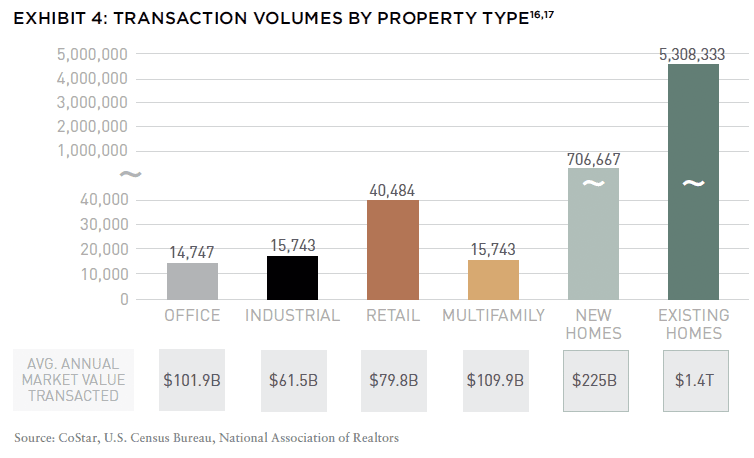
This not only provides price transparency based on millions of homes transacting in the retail market every year, but also the ability to maximize exit options through the higher of either institutional sales or one-by-one dispositions to owner-occupants.
This potential ability to tap a market where homes are regularly bought and sold by retail homeowners represents an important differentiator for the SFR sector, particularly during periods of stress when commercial real estate transaction volumes decline, and pricing becomes opaque with large bid-ask spreads (as seen in the last twelve months). Investors in this sector possess the capability to exit homes individually to traditional homeowners who transact based on retail pricing and comparable sales, and are otherwise indifferent to cap rate valuations.
EXPLORE THE NEW ISSUE

NOTE FROM THE EDITOR: WELCOME TO #15
Benjamin van Loon | AFIRE
MID-YEAR CRE MARKET OUTLOOK: AFIRE
Benjamin van Loon and Gunnar Branson | AFIRE
MULTIFAMILY OUTLOOK: AMERICAN REALTY ADVISORS
Sabrina Unger and Britteni Lupe | American Realty Advisors
MULTIFAMILY GAP CAPITAL: BARINGS REAL ESTATE
Dags Chen, CFA and Lincoln Janes, CFA | Barings Real Estate
SINGLE-FAMILY RENTAL OUTLOOK: CERBERUS CAPITAL MANAGEMENT
Kevin Harrell | Cerberus Capital Management
SINGLE-FAMILY RENTAL SUPPLEMENT: YARDI
Paul Fiorilla | Yardi
LOGISTICS OUTLOOK: BRIDGE INVESTMENT GROUP
Jay Cornforth, Jack Robinson, PhD, Morgan Zollinger, and Cole Nukaya | Bridge Investment Group
DATA CENTER OUTLOOK: PRINCIPAL ASSET MANAGEMENT
Casey Miller and Ben Wobschall | Principal Asset Management
SELF-STORAGE OUTLOOK: HEITMAN
Zubaer Mahboob | Heitman Europe
COLD-STORAGE OUTLOOK: NEWMARK
Lisa DeNight | Newmark
OFFICE OUTLOOK: CUSHMAN & WAKEFIELD
David Smith | Cushman & Wakefield
RETAIL OUTLOOK: MADISON INTERNATIONAL REALTY
Christopher Muoio | Madison International Realty
HOSPITALITY OUTLOOK: JLL
Zach Demuth | JLL
+ LATEST ISSUE
+ ALL ARTICLES
+ PAST ISSUES
+ LEADERSHIP
+ POLICIES
+ GUIDELINES
+ MEDIA KIT (PDF)
+ CONTACT
FAVORABLE SUPPLY TRENDS VS. MULTIFAMILY
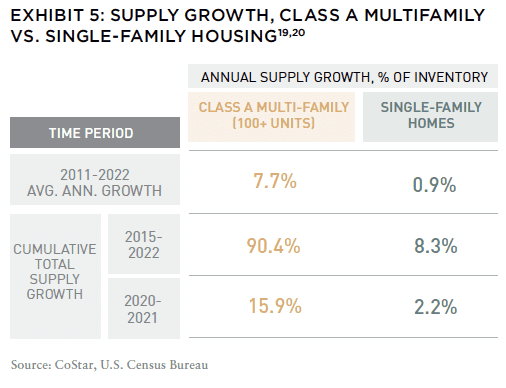
Household formation has outpaced net new construction annually since the GFC, resulting in the largest housing shortage recorded in the last fifty years.10 Developers have notably begun to address this shortage through increased multifamily construction. In the last decade, the annual growth in the multifamily housing supply has surpassed that of single-family homes by 2.1x.18, 19 From 2011 to 2022, the supply of multifamily Class A properties (100+ units) has surged at a rate nearly 8x that of single-family homes.19, 20
RESILIENT RESIDENT BASE
Residential rental housing provides its tenant base with a service that they require regardless of the real estate cycle (i.e., a place to live). This “needs-based” quality means that demand is much more durable than more “GDP-driven” property sectors such as office, retail, and hospitality. This may be one reason why you see office and retail demand decline during recessions (i.e., the corporate tenant base is suffering and does not need space).
While both SFR and multifamily benefit from a “needs-based” tenant, we find that SFR also benefits from lower turnover in comparison to other traditional residential property sectors, like multifamily. Given that multifamily generally skews towards younger tenants with smaller households, there is commonly higher turnover (around 50% or two-year tenant stays) compared to SFR where we have experienced significantly lower turnover (around 25% or four-year tenant stays).21 SFR renters can be less transient, feel a greater sense of community, and often treat the home as their own. Perhaps even more overlooked is that multifamily and single-family product generally do not compete for residents; 90% of multifamily stock today is three bedrooms or less, while 70% of SFR stock is typically three bedrooms or more.21
GREATER IMPACT
Sector selection (i.e., choosing the property type alone) has had a greater impact on returns in private real estate in recent years than at any point in the past three decades.22 Importantly, when comparing single-family housing to commercial property sectors where institutional investors have traditionally generated their returns, single-family rental can often compare more favorably across multiple dimensions.
SFR presents many benefits often not gained in traditional commercial real estate sectors: (1) strong, persistent demographic tailwinds from a supply and demand perspective; (2) larger investable asset class than other real estate sectors; (3) dual liquidity in both the institutional and retail/homeowner markets; (4) better diversification; (5) pricing transparency based on millions of transactions a year and (6) better inflation hedging attributes.
—
NOTES
1. Represents performance of the NCREIF NPI Index, Barclays US High Yield Index, Barclays US Aggregate Bond Index, and the S&P 500 Total Return Index; reference period December 31, 1989–December 31, 2023.
2. Bloomberg, Inflation/Consumer Price Index (CPI YoY) for period starting 1976; as of December 31, 2023.
3. Market sizing determined using GreenStreet estimate of total detached housing units as of January 2024 and Cerberus estimate of $390,000 average home price (units excludes student and senior housing)
4. Morgan Stanley Research; as of December 2023.
5. John Burns Single-Family Rental Analysis and Forecast; as of September 28, 2023. “Institutionally operated” refers to operators that manage a thousand or more SFR homes.
6. Bloomberg, Case-Shiller US National Home Price Index for the period starting December 31, 1975; as of January 31, 2024.
7. Bloomberg, Freddie Mac US Mortgage Market Survey 30 Year for period starting 1976; as of March 31, 2024.
8. J.P. Morgan Research, Existing Mortgage Rates; as of February 2024.
9. Housing Equity, Federal Reserve, Distribution of Household Wealth; as of December 31, 2023.
10. Bloomberg (Ticker: PHUCTOT), New Home Construction, as of Q4 2023 (most recent data available). “Net Home Construction” is defined as new homes built subtracted by deconstructed homes and includes multifamily. (Certain information contained herein is based on Cerberus’ proprietary residential housing models. Such models were created by Cerberus based on historical data and certain assumptions based on Cerberus’ investment experience.)
11. Bloomberg, National Association of Realtors, US Existing Home Sales Inventory for the period starting December 31, 1999; as of February 29, 2024.
Cerberus proprietary models were created by Cerberus based on historical data and certain assumptions based on Cerberus’ investment experience. Determinations based on such models may not prove to be accurate and may not materialize.
12. Bloomberg, National Association of Realtors, US Existing Homes Sales Months Supply NSA for the period starting December 31, 1999; as of March 31, 2024.
13. Bloomberg, US Census Bureau, US New One Family Houses Monthly Supply for the period starting December 31, 1999; as of February 31, 2024.
14. GreenStreet, SFR Sector Outlook; as of January 30, 2024.
15. CoStar, Quarterly Sales Volume for Commercial Real Estate Properties. Reference period March 31, 2000 (earliest available data) to June 30, 2023 (latest available data).
16. Bloomberg, National Association of Realtors, US NAR Total Existing Homes Sales SAAR for the period starting March 31, 2000; as of June 30, 2023. Bloomberg, US Census Bureau, US New One Family 17. Houses Sold Annual Total SAAR for the period starting March 31, 2000; as of June 30, 2023.
18. CoStar, Multifamily annual supply growth for all multifamily properties. Reference period 2011 to 2022.
19. US Census Bureau, Single-Family home annual growth rate, reference period 2011 to 2022.
20. CoStar, Multifamily annual supply growth for Class A multifamily properties (100+ units). Reference period 2011 to 2022.
21. Represents the views of Cerberus as of April 2024. Although Cerberus believes that such determinations are reasonable, they are inherently subjective in nature. Other market participants may make different determinations relating to sector characterization based on their own research.
22. Represents performance of sub-sectors of the NCREIF NPI property index, December 1989–December 2023.
—
ABOUT THE AUTHORS
Kevin Harrell is Managing Director for Cerberus Capital Management, a pioneer in alternative investing with approximately $60 billion in assets across complementary credit, private equity, and real estate platforms.
—
THIS ISSUE OF SUMMIT JOURNAL IS GENEROUSLY SPONSORED BY
Founded in 1992, Cerberus is a global leader in alternative investing with approximately $65 billion1 in assets across complementary credit, private equity, and real estate strategies. We invest across the capital structure where our integrated investment platforms and proprietary operating capabilities create an edge to improve performance and drive long-term value. Learn more.

Principal Real Estate is the dedicated real estate investment team of Principal Asset Management, the global investment solutions business for Principal Financial Group®. As a top 10 global real estate manager, with over $98 billion in assets under management and more than 60 years of experience, we provide clients with access to opportunities across both public and private equity and debt. Learn more.