
Some economic forecasters are still planning on the likelihood of a recession coming sooner than later. Should investors in commercial mortgages worry?
Economic forecasters surveyed for the January 2023 Blue Chip Economic Indicators assigned a 58% probability to a recession in 2023 with most expecting it to be “mild.”1 Should investors in commercial mortgages worry?
In this article, we examine recent US commercial mortgage loan (CML) credit performance and the potential for excess additions to property supply that might threaten credit performance in the quarters ahead. A look back at the 2001 and 2008 recessions suggest that a short, mild recession, as in 2001, could have a minimal negative impact on property performance. As such, there is likely little cause for concern— except in the office sector. While new office supply is minimal, tenants continue to grapple with work-from-home uncertainty.
And as we progress through 2023, investors continue to ponder the possibility of recession in response to the upward push in interest rates that the US Federal Reserve initiated last year to quell inflation. The Fed’s projections call optimistically for a “softlanding” with very weak but still positive annual economic growth in 2023. That outlook could encompass the twoquarters of negative GDP growth envisioned by many private sector forecasters.1
Weak economic growth through 2023 may dampen demand for space throughout the four major property sectors in the commercial property universe, but it will take time to play out. As it does, any negative impact on the net operating income (NOI) of property owners will affect their ability to make mortgage payments.
CREDIT METRICS GENERALLY FAVORABLE THROUGH 2022
Credit performance for commercial mortgages in the later part of 2022 was very solid. As shown in Exhibit 1, current delinquency rates vary by originators and property sectors. (Note that life company and Freddie Mac delinquencies are so low that they are almost invisible on the chart.) The variation among originators occurs largely due to different risk/return profiles for the end investors, which results in different underwriting via higher or lower leverage, longer or shorter interest-only periods, and varying property type allocation, among others—all of which impact the risk of default. Overall, these readings represent recovery from the COVID recession when lodging- and retail-sector delinquencies reached double-digit readings, particularly for mortgages in CMBS securitizations.
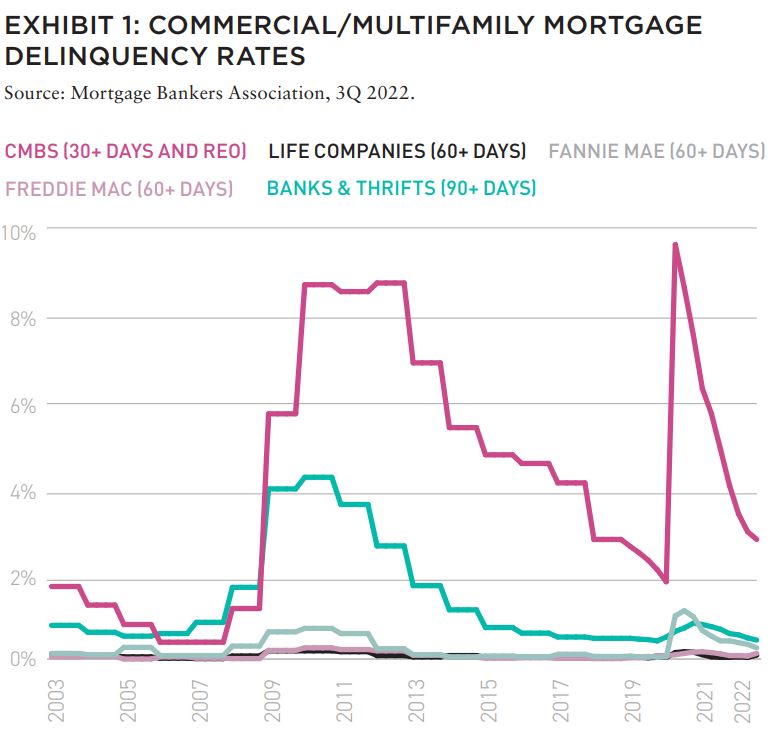
DIFFERENCES IN DELINQUENCY RATES REFLECT PROPERTY SECTOR AND TIMING
Lodging and retail sector mortgages suffered disproportionately during the COVID recession because consumers prioritized shopping online, tourist travel collapsed, and business travel dropped to a bare minimum. The pattern of credit problems within these sectors reflected the degree of impairment in NOIs versus the financial burden of the mortgage debt. Mortgages maturing during the COVID recession were also problematic if lenders were unable or unwilling to extend maturities.
The economic weakening expected into 2023 is unlikely to have a similar disproportionate focus on lodging and retail sectors, which have largely recovered. The focus for a possible 2023 recession appears to be on mortgages secured by office properties. As shown in Exhibit 3, office use has not recovered from the COVID recession when work-from-home became necessary and pervasive to avoid contagion.
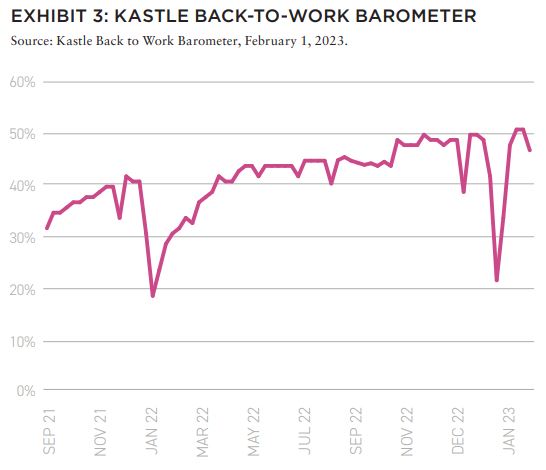
In the aftermath of the pandemic, employers are struggling to bring staff back to their desks while accommodating some of the desire among employees for flexibility to work from home at least some of the time. As a result, office tenants are recalibrating how much space is needed for this more flexible approach to office attendance. At the same time, expectations of an economic slowdown are eroding plans for business expansion and the tech sector separately is restructuring, downsizing, and giving up its glut of office space. And so far, the highest quality office space seems to be suffering the least.
With office leases being generally long term, credit distress among office mortgages will likely play out slowly as leases expire without tenants renewing in full. The pattern of credit problems that emerge will reflect the degree of impairment in NOIs versus the financial burden of the mortgage debt. Mortgages maturing during the uncertain period ahead will also be problematic if lenders are unable or unwilling to extend maturities.
Beyond the difficulties confronting the office sector, credit risk is also increasing for mortgages originated at the peak of the property valuation cycle in 2022. By year-end 2022, property values tracked by the MSCI-RCA Commercial Property Price index were up from their pre-COVID March 2020 level by 52% for industrial, 31% for multifamily, 19% for office, and 22% for retail.2 Beyond the generalities associated with each property sector, any increase in risk will depend on the characteristics of each specific mortgage.
PARSING LEVERAGE AND DEBT COVERAGE THROUGH MATURITY
Evaluating prospects for an increase in CML risk through the quarters ahead requires examination of the degree of leverage, strength of property cash flow and debt coverage, and the timing of lease rollovers ahead.
At origination, lenders will calibrate loan-to-value ratios and debt service coverage requirements that are within their risk tolerances. Beyond these calculations, lenders are well-advised to consider the vulnerability of each property to downside risks to value and cash flow over the entire term of the mortgage.
This analysis requires consideration of property quality and competitiveness with its peers, the timing of tenant rollover, capacity of the market to generate competitive new supply, and the expertise of property managers. Evaluation of climate risk is also becoming important. We believe property leverage should be low enough to withstand evolving risks with a cushion for the unknowable.
VULNERABILITY TO RECESSION VARIES WIDELY ACROSS SECTORS AND LOCALES
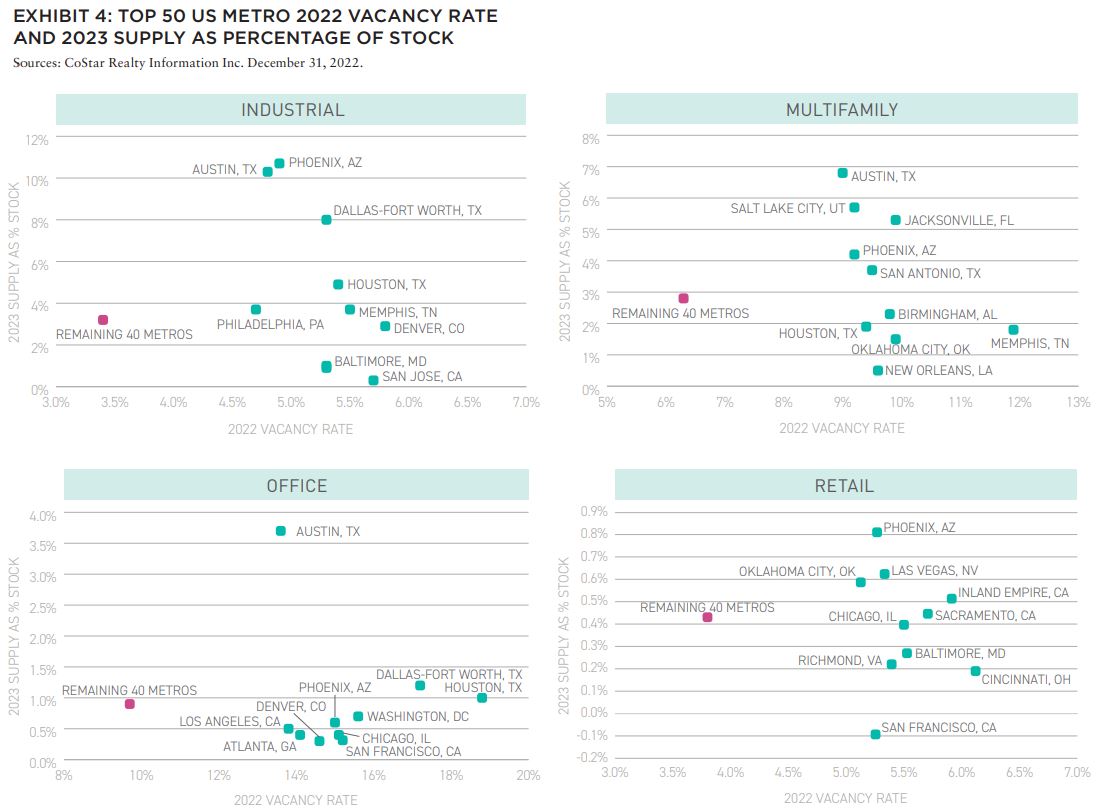
A crucial component of property-by-property credit risk evaluation is examination of current excess supply in each property’s metro area.3 The most concerning source of excess supply that might threaten CML credit is newly–constructed supply that will become available as the economy weakens. For metros with low vacancy rates, new supply might be digested without disrupting credit performance. But, if vacancy rates are already high, absorption might create winners and losers. Exhibit 4 summarizes our examination of the fifty largest US metros identifying the ten with the highest year-end 2022 vacancy rates and their supply addition expected for 2023, compared to the average year-end vacancy rate and supply addition for the remaining forty metros.
As shown, there is wide variation across property sectors and metros but generally supply inflows are modest for 2023. Several metro areas are worth monitoring, however, including Austin’s relatively booming inflow across industrial, multifamily, and even office sectors. Phoenix bears monitoring as well, especially in the industrial sector.
The capacity to absorb space also differs by property sector and metro. It will refl ect the vulnerability of a metro’s economy to weakening economic growth along with the structural forces affecting each metro’s business composition and demographics. Vulnerability to weakening growth might be similar to the pattern revealed in past recessions. This pattern is shown in Exhibit 5, which contains the change in vacancy rates and NOI in the two years following the beginnings of the 2001 and 2008 recessions. (We examine two years to account for the lag in property responses to recession. Results are calculated for the top 50 metros arranged in groups of 10 ranked by vacancy rate change.)
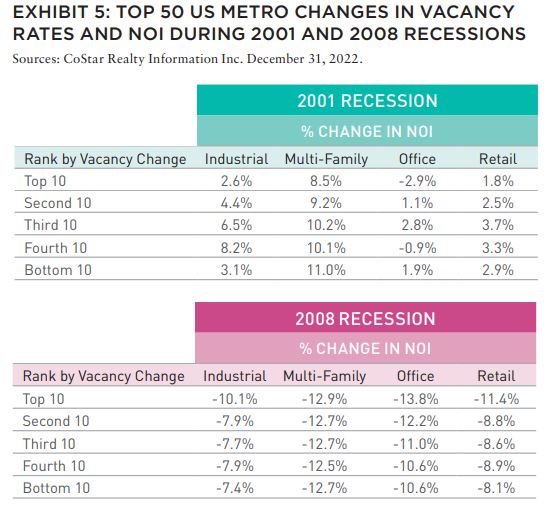
The historical results are interesting in that they demonstrate that all recessions are not alike. The 2001 recession produced less than a 2% loss in real GDP over its eight months and without significant negative impact on NOIs, except for office properties.4 The metros with the most severe office vacancy rate increases suffered an average of 2.9% decline in NOI. In contrast, the 2008 recession produced a loss in real GDP in excess of a 4% decline in GDP over its eighteen-month duration, and produced severe negative impact on NOIs across all four major property sectors.5
Current expectations point to a short and mild 2023 recession more similar to the one in 2001. If this scenario occurs, the negative impact on NOIs might well be modest and aligned with excess supply and structural woes in the office sector.
Regulatory changes affecting originators after the Great Financial Crisis (GFC) also provide reassurance that delinquencies will remain more modest than the GFC record. The changes enforce more conservative underwriting among the regulated originators leaving high-risk lending to non-regulated entities. Notable regulatory enhancements include the requirement that CMBS originators or another party retain a slice of the credit risk and that life company originators hold capital based on annually updated leverage and debt coverage metrics.
LOOKING AHEAD AT 2023
The outlook from the February 2023 Blue Chip Economic Indicators survey suggests that commercial mortgage credit risk in the quarters ahead will be cushioned by the relatively low vacancy rates and modest supply pipelines reviewed in this paper. While a small number of US metros will be faced with excess supply flows in the face of waning economic growth, the more pressing concern is the unsettledness in the office sector.
In addition, mortgages originated at the peak of the property valuation cycle in 2022 might also be a concern if the original underwriting was especially optimistic. Maturing mortgages are a challenge if the property fundamentals have weakened but extending the maturity dates should relieve some of the heat.
Altogether, CML credit risk prospects for 2023 will vary mostly by property sector and the fundamental characteristics of individual properties. These expectations reinforce the value of portfolio diversification: by property sector, origination and maturity dates, metro area, and property fundamental characteristics.
EXLORE THE FULL ISSUE

ALSO IN THIS ISSUE
AFIRE INTERNATIONAL INVESTOR SURVEY: Q1 2023 PULSE REPORT
Gunnar Branson and Benjamin van Loon | AFIRE
VALUATION CHALLENGE: SOLVING THE CRISIS IN COMMERCIAL REAL ESTATE VALUATION
Matt Pomeroy, MAI and Jackie Bowie | Chatham Financial
CONVERSION CALCULATOR: LEGAL OR NOT, A DYNAMIC CITY WILL CONVERT UNUSED OFFICES
Jim Costello | MSCI Real Assets
UNDERWRITING ROADBLOCKS: CAN THE HOSPITALITY MODEL OF UNDERWRITING SAVE OFFICE VALUES?
Joshua Harris, PhD | Lakemont Group & Fordham University
VACANT SPACE: OFFICE-USING JOBS AND DEMAND INCONGRUITY
Stewart Rubin and Dakota Firenze | New York Life Real Estate Investors
HIKING TRAILS: SHOULD INVESTORS CONSIDER ALLOCATIONS TO FLOATING-RATE DEBT?
Dags Chen, CFA | Barings Real Estate
RECESSION PREPPING: HOW VULNERABLE ARE COMMERCIAL MORTGAGE INVESTMENTS
Martha Peyton, PhD | Aegon Asset Management
MEASURING GENTRIFICATION: USING DATA SCIENCE TO PREDICT THE IMPACTS OF GENTRIFICATION
Ron Bekkerman | Cherre + Donal Warde | Tenney 110 + Maxime C. Cohen | McGill University
THE FUTURE IS EUROPEAN: THEMES FROM THE OLD WORLD SHAPING US MARKETS
Brian Klinksiek | LaSalle Investment Management
CULTURE SHOCK: THE CHALLENGE AND IMPORTANCE OF TRANSLATING ESG ACROSS BORDERS
AFIRE ESG Committee
FINE TUNING: GLOBAL REACH AND LOCAL EXPERTISE CAN CREATE UNIFIED REAL ESTATE EXPERIENCES
Mark Zettl | JLL
ACCESSING SUCCES: EXPLORING DIVERSITY TRENDS IN REAL ESTATE TALENT
Zoe Huges | NAREIM
RESCUE CAPITAL: RESPONDING TO THE NEW REAL ESTATE REALITY
Andrew Weiner and Joshua M. R. Becker | Pillsbury
CONVEX CURVES: A REMINDER ON PRICE CONVEXIVITY AND CAP-RATE VOLATILITY
Joseph Pagliari, PhD, CFA, CPA | University of Chicago
IN MEMORIAM: ANDREA MARIE CHEGUT, PhD, MIT
—
ABOUT THE AUTHORS
Martha Peyton, PhD, is Managing Director of Real Assets Applied Research for Aegon Asset Management, the global investment management brand of Aegon Group.
—
NOTES
1. Wolters Kluwer. Blue Chip Economic Indicators. February 10, 2023.
2. MSCI Real Capital Analytics. December 31, 2022.
3. The focus on metro market is dictated by the metro scope of demand which is driven by metro area economic vitality. Within metros, excess supply in any individual submarket will be corrected by rent reductions which will equilibrate demand across submarkets while accounting for the value of each submarket’s specific attributes. We can assume that this process works because the federal government identifies the counties to be included in each metro by assessing their economic and social integration.
4. CoStar Realty Information Inc. December 31, 2022.
5. US Bureau of Economic Analysis. Gross Domestic Product. January 26, 2023.
—