
Investors in commercial real estate are forecasters by necessity. Whether collecting and personally constructing discounted cash flows, managing others who do so, or signing off on buys and sells, we are all forecasters.
Our forecasting requires making assumptions about rent, occupancy, expenses, and borrowing rates. The foundation for these assumptions is the current and expected dynamics of the national economy and of the specific property location, its surrounding submarket, and larger metro area market. Commonly, historical data and forecasts are purchased from one or more vendors and judgement is applied to how they are used in property buy-sell analysis.
Making such judgements has been especially fraught in recent years. The COVID-19 pandemic and its aftermath distorted every factor affecting property performance. Perhaps foremost, COVID-19 pushed the US economy into freefall in mid-2020 with real GDP plummeting at a 28% rate in Q2 2020 and the unemployment rate exploding from 3.8% to 13%.[1]
Policymakers responded quickly and aggressively; the federal funds rate was cut to essentially zero by April 2020 and the March CARES Act sent support payments to individuals and families. Further federal aid was implemented in 2021 as the COVID-19 vaccine subdued the pandemic. The COVID-19 disruption along with the beginning of the war in Ukraine accelerated inflation and prompted the Federal Reserve to tighten interest rates by 525 basis points beginning in 2022.[2] The rate increases fed fear of a hard landing recession which persisted into 2023.
Through this period, property investors pulled back and transactions dropped precipitously as COVID-19 recession risk was followed by “hard landing” fears. Property analysis was difficult through this period, resulting in widening in bid-ask spreads as buyer and seller views disconnected. More recently, the resilience of the economy in the face of high interest rates has quelled hard landing fears and a modest soft-landing growth path is now widely expected. The intense scrutiny of macro-economists and their soft-landing consensus are forging more agreement among forecasters, but COVID-related distortions linger. Uncertainty related to work-from-home, online shopping, the search for affordable housing, and similar trends are well-covered by real estate analysts. But less attention has been devoted to what might be the most important uncertainty now at play: the geography and magnitude of US population growth.
DEMOGRAPHICS DRIVES ECONOMIC GROWTH
Population growth is a fundamental driver of demand for almost all types of real estate. Even more fundamental is the link between population growth and economic growth. Population growth fuels labor force growth which combines with productivity to generate growth in GDP.
The 1.8% long-term GDP growth reported in the Federal Reserve’s Economic Projections assumes enough labor force growth to support long-term unemployment at 4.2% with inflation averaging 2%.[3] The Congressional Budget Office (CBO) is also projecting a 1.8% long-term GDP growth rate with similar 2% inflation prospects.
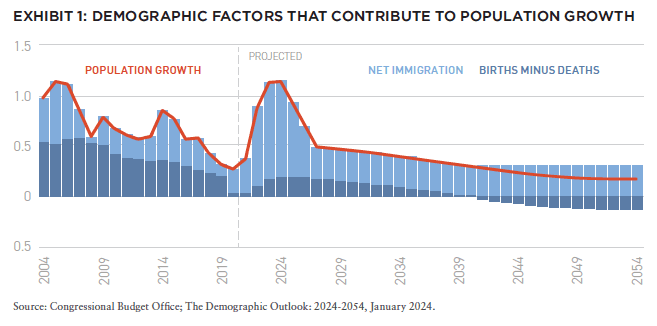
CBO’s report specifies a 0.4% population growth rate to support these projections, a rate only slightly less than the 0.5% increases posted in 2018 and 2019. As shown in Exhibit 1, the “natural rate” of population growth produced by births exceeding deaths has been shrinking due largely to a declining fertility rate. The cultural forces behind delayed marriage and fewer (if any) children are well-established and unlikely to change in the years covered in the CBO forecast. This leaves US population growth largely dependent on the flow of immigrants.
Therein lies enormous uncertainty. Immigration is affected by conditions in the countries that immigrants leave. Political and civil unrest as well as limited economic opportunities encourage residents to seek better lives elsewhere. Perceived opportunity in the US encourages them to come here. US immigration regulations are complications leaving some to immigrate illegally. (The COVID-19 pandemic disrupted immigration flows as shown in the sharp 2020 decline in Exhibit 1).
VERY WIDE RANGE OF POPULATION CHANGES ACROSS METROS
Meanwhile, population growth rates vary widely across US metro areas. Varying flows of immigrants is one source of the differences along with the varying flows of domestic population. Age composition matters as well in that metros with concentrations of old people or young people will have differences in their natural rate of population growth.
Metro area population growth directly fuels demand for housing and retail space. It provides the workforce that supports demand for office and industrial space. It accumulates the stuff that goes into self-storage. It is the invisible assumption embedded in property discounted cash flows.
Investors need to pay special attention now to the invisible metro area population growth assumptions because the COVID disruption has made recent history deceptive.
For example, the 2020 Census, conducted in April 2020, was the last full count of population. The Census is conducted every ten years; updates are produced annually using samples of population designed to represent the whole. A reasonable approach for forecasting metro area population in the immediate years ahead would focus on the 2020 Census and updates through 2023.
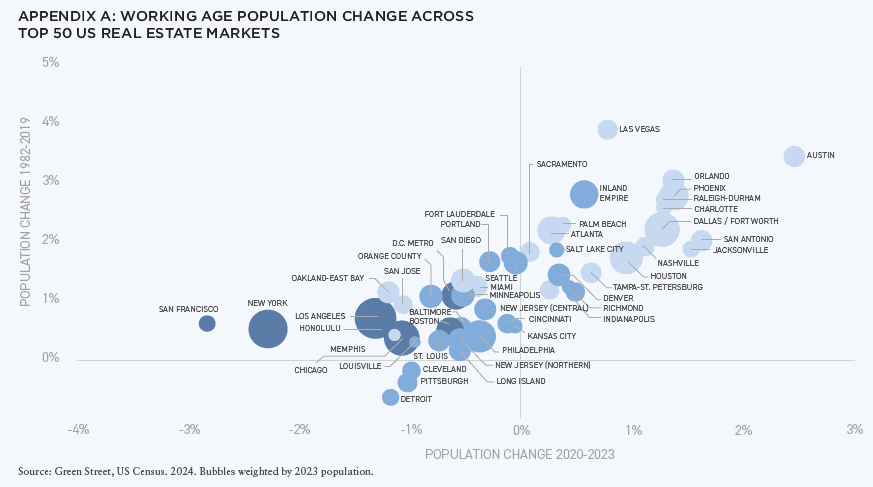
For the fifty-six large liquid metros of over one million in population that are commonly targeted by institutional real estate investors, the most recent data for 2020-23 shows average population growth of 1.13%. The range is enormous, from 7.5% for the Austin metro to -4.3% for the New Orleans metro. Before pushing this historical performance forward in a forecast, some further analysis is obviously required.
Of course, COVID played a part in the 2020-23 results. Anecdotal reports point to the work-from-home protocols that COVID necessitated and the opportunity for individuals to relocate to cheaper locations that work-from-home afforded. The data support this contention, but only weakly; of the nineteen metros that lost population between 2020 and 2023, only nine are identified by Green Street as having “very expensive or expensive” housing. Moreover, the 2020-2023 history is a less-than-ideal basis for forecasting now that the COVID-19 pandemic is over and employers are pulling staff back to the office. Further insights are available from the annual data within the 2020-2023 time period. The weakest average population growth for the fifty-six metros occurred between 2020 and 2021 at 0.2% for the year. The average strengthened to 0.4% in the following year and then leveled to 0.5% in the 2022-2023 reading. Twenty-one metros lost population over 2020-2021, twenty-four in the following year, and seventeen in 2022-23.[4] Will those seventeen shrink perpetually? Similarly, will the fourteen metros that enjoyed the strongest population growth of 1% and better in 202223 continue to boom? These are questions that real estate forecasters and investors are well advised to address.
COMPONENTS OF POPULATION CHANGE SHOW NARROWING OF DISPARITIES
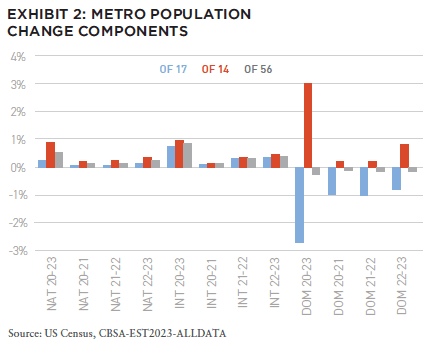
To address these questions, more detailed information is available in the components of metro area population change. The components include the natural rate of population growth from births net of deaths, net inflows from elsewhere in the US shown as domestic (“dom” in Exhibit 2), and net inflows from outside the US shown in the chart as “int.” COVID-19 affected all three components.
For the seventeen metros that suffered population shrinkage in 2022-23, the pace of decline was much reduced compared with the two prior years. The improvement was due to a pickup in immigration combined with a reduction in the rate of domestic move-outs.
For the fourteen metros with strong 2022-23 population growth, the pace of growth was slower than the 2021-22 rate but still above the 2020-21 pace.[5] For these metros, immigration strengthened in 2022-23 but the pace of domestic move-ins declined. The natural rate of increase improved in 2022-23 for both groups of metros.
These metrics show that COVID-19’s impact on population movements was easing in 2022-2023. But the data show that the shrinking metros continued to suffer domestic move-outs, albeit at a reduced pace, and the strong metros continued to grow faster. Is this likely to continue? Forecasters need to weigh the data and construct assumptions regarding future movements. In doing so, they will need to weigh the relative attractiveness of employment opportunities along with relative housing affordability.
In some of the shrinking metros, employment related to the AI boom is growing driven by the availability of tech talent and the tech sector more generally appears to be stabilizing after its restructuring. Housing is still relatively more expensive but comparatively less so in the metros that built gluts of high-quality apartments.
In the stronger metros, employment opportunities derived from work-from-home are diminishing. Housing prices and rents have risen strongly. Both are forces of convergence. It also bears stressing that judgements regarding these forces should be devised for each individual metro area separately.
The path ahead will also depend on the pace of immigration overall as well as the inflows of immigrants to each metro area. The importance of immigration is evident in both groups of metros. In 2020-21 the pace of immigration dropped sharply in response to COVID restrictions and fears. The subsequent two years saw revived immigration flows that were stronger than the natural rates of population increase in both groups of metros and for the average of all the large million-plus metros.
Looking ahead, appetite for opportunity and security in the US is showing no sign of diminishing. Global political upheavals and climate disasters feed this appetite and are unlikely to diminish. Immigration is a hot political issue in the US and unpredictable policy choices will have an impact on the flow of immigrants in the years ahead.
Metro area population changes in the years ahead will also be affected by the geographic pattern of climate change along with the impact of climate change on housing costs and employment growth. Property hazard insurance costs and availability are already showing widening disparities across locations as storm and fire events become more frequent. Property investors who ignore these risks may be left with stranded assets if others act more expeditiously. LGIM researchers are focusing on these questions (See sidebar)
RETURNING TO NORMALITY
Examination of the components of metro area population changes shows that the drivers of change were converging across metros in 2022-2023. This suggests that COVID-19 was a demographic shock with dissipating effect. Disparities remain but the direction of change is toward narrowing the gap between metros with declining population and those with fast growing population.
Forecasters are left to make judgements about where and when an eventual equilibrium will occur, but this analysis should leave us wary of making simplistic assumptions on population changes, the domestic and international migration that drives them and the impact on metro area economic vitality.
NEW: SUMMIT #17

+ EDITOR’S NOTE
+ ALL ARTICLES
+ PAST ISSUES
+ LEADERSHIP
+ POLICIES
+ GUIDELINES
+ MEDIA KIT
+ CONTACT
WHERE ARE WE IN THE CYCLE?: OVERVIEW OF THE US ECONOMY AND REAL ESTATE SECTOR
Richard Barkham + Jacob Cottrell | CBRE
COMPELLING OPPORTUNITIES: MAKING A CASE FOR US REAL ESTATE
Karen Martinus + Mark Fitzgerald + Max von Below | Affinius Capital
OPEN WINDOW: WHY NOW IS THE TIME TO INVEST IN COMMERCIAL REAL ESTATE
Chad Tredway + Josh Myerberg + Luigi Cerreta | JPMAM
NORMALIZING MOVEMENT: POPULATION MOVEMENTS NORMALIZING AFTER COVID-19 SHOCK
Martha Peyton + Matthew Soffair | LGIM America
CHRONIC SHORTAGE: THE US HOUSING SCARCITY WILL BE LIKELY TO PERSIST FOR SEVERAL YEARS
Gleb Nechayev | Berkshire Residential Investments
FLORIDA FOCUS: PRODUCTION INDEX BELOW 50 CURIOUSLY SIGNALS OPPORTUNITY
Rafael Aregger | Empira Group
WHOLESALE CHANGE: DEMOGRAPHIC CHANGES AND STAGNANT INVENTORY CREATE NEW OPPORTUNITIES FOR RETAIL
Stewart Rubin + Dakota Firenze | New York Life Real Estate Investors
GAME CHANGE: INFRASTRUCTURE GROWTH ACCELERATING WITH AI
Jon Treitel | CBRE Investment Management
FOR THE TREES: MASS TIMBER INTEGRATION IN INDUSTRIAL REAL ESTATE
Mary Ellen Aronow + Erin Patterson + Caroline Suarez + Cassidy Toth | Manulife Investment Management
BORDER INDUSTRIAL: INVESTING IN US/MEXICO BORDER PORT INDUSTRIAL MARKETS
Dags Chen, CFA + Lincoln Janes, CFA | Barings Real Estate
RESILIENCE AMIDST UNCERTAINTY: HOW ISRAELI AND UKRAINIAN INVESTORS ARE ADAPTING REAL ESTATE STRATEGIES DURING CONFLICT
Asaf Rosenheim | Profimex
CYBER RISK VIGILANCE: HOW REAL ESTATE DIRECTORS AND BOARDS CAN GUARD AGAINST CYBER RISK
Marie-Noëlle Brisson, FRICS, MAI + Michael Savoie, PhD | CyberReady, LLC
ALTERNATE REALTY: DIGITAL RIGHTS MANAGEMENT FOR REAL ESTATE AND AUGMENTED REALITY
Neil Mandt | Digital Rights Management + Steve Weikal | MIT Center for Real Estate
DRIVING FORCE: UNDERSTANDING SYNDICATED LOANS AND MULTI-TIERED FINANCING
Gary A. Goodman + Gregory Fennell + Jon E. Linder | Dentons
HOUSING COMPLEX: CUTTING-EDGE APARTMENTS ARE A CATALYST FOR A MORE PROFITABLE FUTURE
Alejandro Dabdoub | AOG Living
DEMOGRAPHIC DETAIL: HOW CLIMATE AND THE PANDEMIC ARE IMPACTING US REAL ESTATE
Population movements are a critical and often under-appreciated driver of potential relative real estate returns
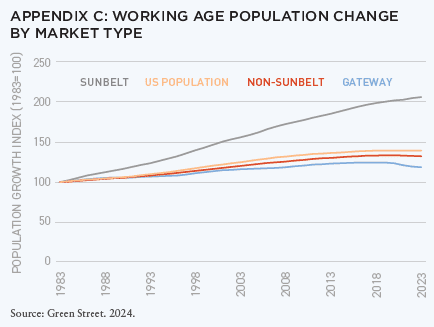
The pandemic and the associated acceleration in working from home benefited Sunbelt markets at the expense of coastal Gateways. However, this trend is normalizing.[6] And While the near-term prospects for employment growth in Sunbelt markets remain strong, over the longer term we expect this relative strength to moderate, with climate risk an increasingly important factor.
Recent extreme weather events are a stark reminder of the potential physical impacts of climate change, but of equal importance are the chronic physical climate risks that negatively impact the liveability of certain markets. These could hurt the long-term attractiveness of some Sunbelt markets, and provide potential upside for a few more resilient non-Sunbelt markets, necessitating more nuance around location selection for long-term investors, with implications for cap rates.
Real estate and infrastructure assets in higher climate risk areas will increasingly have to contend with the additional capex required for adaptation, the loss of revenues from operational disruptions and higher insurance premiums.
Heightened climate-associated risks and costs could exacerbate existing supply constraints in residential markets. Extending the useful life of existing supply, through retrofitting and decarbonization strategies, will be increasingly important in addressing local supply and demand imbalances, in our view.
1. POPULATION FLOWS POST-PANDEMIC: WHAT HAS HAPPENED AND WHY?
Population growth is a fundamental driver of demand for almost all types of real estate. Growth across US metro areas has varied widely in recent years; for the fifty-six large, liquid metros with a population of over one million that are commonly targeted by institutional real estate investors, the most recent data, for 2020-2023, shows average population growth of 1.1%.[7] The range is enormous, from 7.5% for the Austin metro to -4.3% for the New Orleans metro (see chart below). We believe the longevity of these trends, and future long-term drivers of population flows, will be key to real estate performance.
The pandemic period (2020–22) was characterised by an acceleration of the long-standing trend of stronger population flows towards Sunbelt markets. This was predominantly driven by two factors:
- Increased working from home untethering people and businesses from city life
- Cost of living concerns, with expensive coastal markets most severely impacted
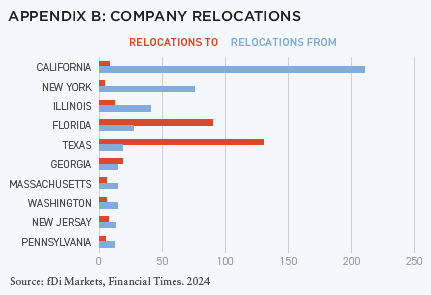
Businesses have also followed this trend, with growing numbers of companies relocating to Sunbelt markets, attracted by easier tax and regulatory regimes, as well as appropriately skilled labour forces.
This trend is partially normalizing. While Sunbelt markets continue to see population growth, this has reverted to levels closer to the pre-pandemic trend (Appendix C). While non-Sunbelt markets are still seeing working-age population declines, these have slowed notably, with the likes of Washington and Massachusetts witnessing a return to positive population growth.
Normalizing population data suggests that COVID was a demographic shock with a dissipating effect. Despite a challenging pandemic period, we believe Gateway markets should not be discounted, with these continuing to attract high volumes of inward domestic migration from younger demographics (i.e., 18-35 year-olds) and international migrants over the 2010-23 period (United States Census Bureau, 2024). While immigration remains a highly sensitive political topic, an ageing US population means it is likely to be an increasingly critical driver of future population—and employment—growth.
2. LONGER-TERM DRIVERS OF POPULATION FLOWS: RESPONDING TO GROWING CLIMATE RISKS
The importance of climate in influencing population flows across the US is not new; since the 1960s, growing numbers of the US populace have been moving away from the cooler Northeast and Midwest to warmer areas.
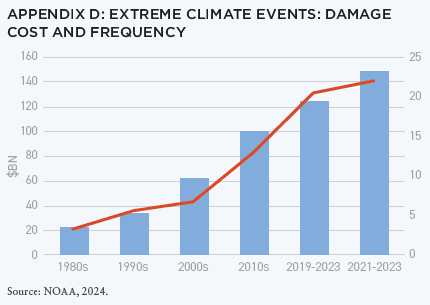
However, more extreme weather events and the hotter climate are posing a risk to this long-standing trend. The frequency, costs and human impact of extreme weather events are growing (Appendix D), with Hurricanes Milton and Helene providing stark recent examples.
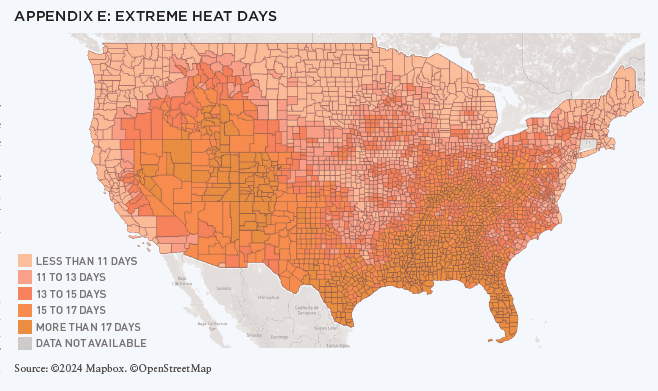
Weather events and more chronic climate risks, such as extreme heat days and increasing water scarcity, are impacting the liveability of higher-risk locations, and there is emerging evidence of a consequential effect on population flows. Leduc and Wilson (2024) analyzed the relationship between population growth, extreme heat days and extreme cold days at a county level. They found that over the past five decades, the historically positive relationship between population growth and the number of extreme heat days, and the historically negative relationship with extreme cold days, had weakened, and according to some measures, even reversed.[8]
If this moderating trend persists, it could present a risk to the long-established positive migration story for the Sunbelt, requiring a more granular and selective approach when targeting real estate markets within the region. Conversely, more resilient Gateway markets may benefit from renewed population inflows in response.
3. CLIMATE AND INSURANCE: AN INCREASINGLY MATERIAL IMPACT ON CASHFLOWS
Climate is having a more immediate impact on real estate returns through insurance. Rising climate-related insurance claims are leading to increased costs and reduced availability in higher-risk areas. Keys and Mulder (2024) observed a 33% increase in average premiums for homeowners between 2020-23 (13% in real terms), with “a one standard-deviation increase in disaster risk associated with $500 higher premiums in 2023, up from $300 in 2018,” indicating a causal relationship between climate risk and higher increases in insurance premiums. Meanwhile, Green Street (2024) noted that annual commercial property insurance premiums were up 11% p.a. over 2018-2023, versus 4% for wider real estate expenses.
While insurance has historically represented a relatively negligible expense for commercial real estate investors, this is likely to become a more meaningful cost in higher-risk sub-markets. For example, Green Street estimates that home insurance costs in 2023 represented 9% of after-tax income in Miami, versus a national average of 3%.
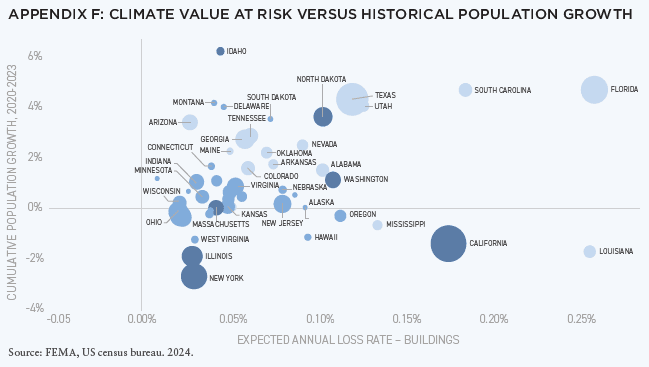
Appendix F shows that climate event risks tend to be higher in some Sunbelt markets, many of which have seen significant recent population growth and strong real estate performance. In future, our view is that the region should not be viewed in a homogeneous way, necessitating more nuance around location selection for long-term investors.
4. CLIMATE RISKS AND IMPLICATIONS FOR INFRASTRUCTURE
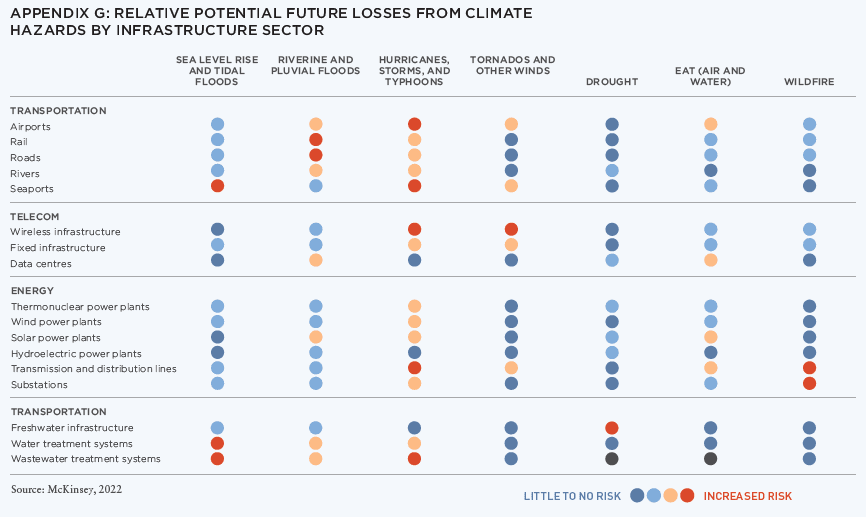
Extreme weather is increasingly an operational risk for key infrastructure assets, such as power networks, airports and wind farms. Infrastructure typically involves considerable upfront investments in assets designed with useful lives of up to 100 years, with the design of these facilities usually assuming past climate patterns will continue. A changing climate, however, and the resulting extreme weather events mean that historical climate bands utilised in planning are becoming outdated, in our view, leaving infrastructure in many locations operating outside of its tolerance levels. McKinsey highlights the relative climate risk across infrastructure sectors in Appendix G, with transport, energy transmission, and water infrastructure screening as most at risk.
5. BUILDING RESILIENCE TO CLIMATE AND TRANSITION RISKS
We expect asset-level climate-risk analysis to become an increasingly important component of portfolio management and stock selection in the future, with higher-risk locations becoming more vulnerable to changing occupier demand, increased operating costs and reduced liquidity at exit. Robust assessments of climate risks require granular, building-level assessments alongside an appreciation of wider interdependent risks, such as neighbourhood-level infrastructure vulnerabilities.
We believe any consideration of future portfolio resilience increasingly needs to consider net-zero transition risks. The built environment is a significant contributor to global carbon emissions, and, while the stringency of decarbonisation legislation varies significantly by state, over the long term we expect the sector to be subject to increasing scrutiny from regulators and wider stakeholders. We believe a proactive approach to mitigating environmental risks is prudent and expect real assets with greater transition and climate exposure to be negatively affected, leaving uncompliant assets with reduced liquidity.
We also expect a proactive approach to confer some early mover advantages and upside potential in rental outcomes in more supply-constrained markets. We believe heightened climate risk and increased insurance and adaptation costs will exacerbate existing constraints in residential supply, particularly in a number of larger Gateway markets. This requires, in our view, a focus on retrofitting existing stock, thereby extending the useful life of the buildings, reducing their energy and fossil fuel consumption and ongoing repair and maintenance costs.
OUR VIEW
As climate-related disruption becomes more frequent, we believe both real estate and infrastructure investors will increasingly have to contend with the additional capex required for adaptation, loss of revenues from operational disruptions and higher insurance premiums. We have seen early signs of elevated climate risk translating into higher costs for assets located in particularly vulnerable locations and expect this to become a more prominent trend as climate risks intensify.
In our view, investors will have to:
• Increase the depth and granularity of climate risk due diligence at an asset level, considering future climate scenarios
• Regularly review portfolio climate resilience assessments under various climate-change scenarios
• Review cashflow assumptions in terms of capex, operating costs, reletting risks and discount rates
• Consider emerging risks in fair value analysis • Renew their emphasis on diversification, tilting away from areas of greater climate risk within their portfolios
NOTES
1. Bloomberg
2. The Federal Reserve
3. The Federal Reserve: Economic Projections. Data as of June 12, 2024.
4. Seventeen metros with declining 2022-23 population: New Orleans, Los Angeles, Honolulu, Pittsburgh, New York, Buffalo, Rochester, San Francisco, Memphis, San Diego, Chicago, Detroit, St. Louis, Cleveland, Portland, Baltimore, San Jose.
5. Fourteen metros with strongest 2022-23 population growth (1% or more): Phoenix, Tulsa, Atlanta, Oklahoma City, Nashville, Tampa, San Antonio, Charlotte, Houston, Dallas, Raleigh, Orlando, Austin-, Jacksonville, FL.
6. Sunbelt markets categorized at state level as Alabama, Arizona, Arkansas, Colorado, Florida, Georgia, Kansas, Louisiana, Mississippi, Nevada, New Mexico, North Carolina, Oklahoma, South Carolina, Tennessee, Texas and Utah. California has been defined as a Gateway market.
7. United States Census Bureau, July 2024.
8. Extreme hot day classed as a day where the average 24-hour temperature was above 80 degrees Fahrenheit, with an extreme cold day being one where the temperature was beneath 20 degrees Fahrenheit. The same trend is observed when replacing population with net migration.
ABOUT THE AUTHORS
Martha Peyton is a Research Consultant to LGIM America’s Real Estate Equity team. In this role, she is responsible for US economic and property market research, which is a foundation for the team’s investment strategy.
In Legal & General’s Private Markets investment strategy and research team, Matthew Soffair is responsible for market research, influencing strategic operational initiatives and guiding investment strategy in the retail, leisure and hotel sectors, while also being responsible for research into key thematic areas, including transition risk, operational research and emerging alternatives sectors.
THIS ISSUE OF SUMMIT JOURNAL IS GENEROUSLY SPONSORED BY
/ EXECUTIVE SPONSOR
AOG Living is a leading fully integrated, multifamily real estate investment, construction, and property management firm headquartered in Houston, Texas. AOG Living has acquired, built, or developed more than 20,000 multifamily units with a total aggregate value of over $2.4 billion and has a growing portfolio of more than 35,000 apartment homes and 170+ properties under management throughout the nation. Learn more at aogliving.com.
/ ASSOCIATE SPONSOR

Vertically integrated owner, operator, and developer of Sunbelt multifamily. Partnering with institutions on a single-asset and programmatic basis. 28k+ units acquired and developed. 62k+ units under management. 1,500+ associates. 8 Sunbelt states. To learn more, visit hrpinvestments.com and hrpliving.com. And for more information, contact john.duckett@hrpliving.com.
/ SUPPORTING SPONSOR
Affinius Capital is an integrated institutional real estate investment firm focused on value-creation and income generation. With a 40-year track record and $64 billion in gross assets under management, Affinius has a diversified portfolio across North America and Europe providing both equity and credit to its trusted partners and on behalf of its institutional clients globally. To learn more, visit affiniuscapital.com.