
From its pandemic-era pedestal, the multifamily sector has lost some favor recent quarters amidst an unleashing of new supply that has challenged the health of fundamentals across the US.
The impact of these altered fundamentals has exacerbated challenges created by the broader higher interest rate paradigm, increasing capital stack-related stress as maturing loans face considerably higher refinancing costs alongside the added one-two punch of weakened operating margins.
Paradoxically, the for-sale housing market has not seen much improvement for increasing accessibility for renters. Home prices have continued to climb upward, with national annual price growth reaching 6% in January 2024; the fastest year-over-year rate since 2022.1
Available inventory remains subdued compared to historic levels as would-be resellers remain in place at higher numbers by virtue of the “golden handcuffs” afforded them by their existing low mortgages. Plainly put, Americans in most states require a six-figure salary to afford a median-priced home—a 50% increase in required income in just the last four years.2 But if renters are not entering the for-sale market, and the longstanding belief has been that the US is chronically under-housed, why aren’t apartment fundamentals stronger? And what opportunities will this set up for investors (and where) over the next eighteen to thirty-six months?
SUPPLY SIDE OF THE EQUATION
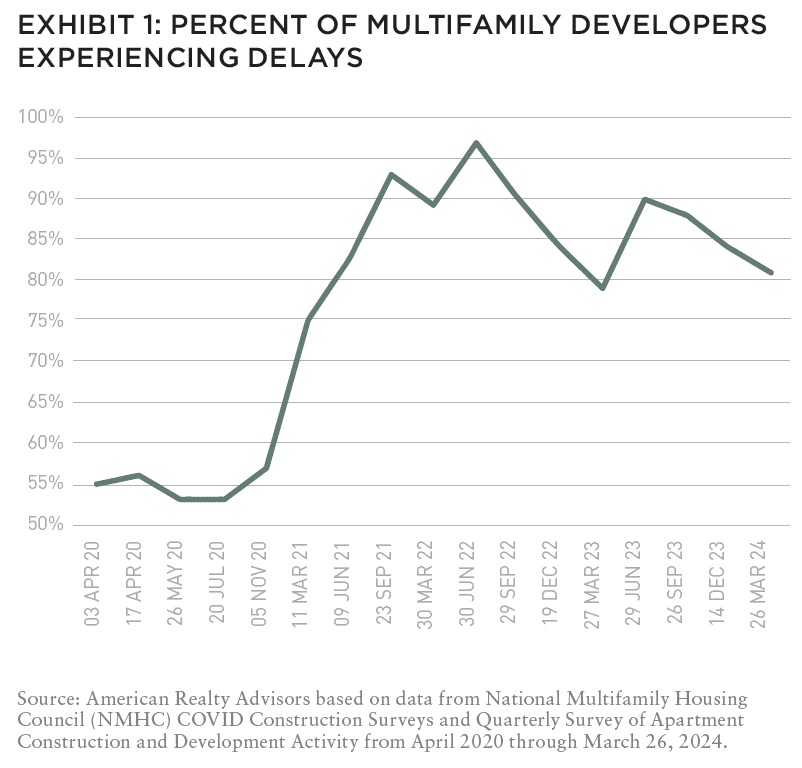
Some of today’s apartment challenges can be attributed to good old-fashioned timing. The work-from-home orders, supply chain snarls, and permitting office backlogs of the pandemic created material delays in project timelines for many multifamily developers. At the peak in 2022, 97% of respondents to the National Multifamily Housing Council’s survey of apartment construction and development activity reported experiencing construction delays (Exhibit 1).
While these delays had the effect of deepening the anomalously strong rent growth experienced in late 2020 and 2021 (as rebounding demand far outpaced constrained supply and on its own spurred further late cycle starts from those looking to take advantage of a hot market), it also led to all-time high deliveries hitting the market at around the same time demand started moderating from its breakneck pace. In many ways, this trend was akin to a flowing river being blocked by a dam, with water steadily building up behind it. When the gates open, the dammed water comes rushing forth at once, flooding areas downstream.
In other words, investors are waiting for the standing water to recede to be able to truly assess what’s beneath the waterline.
DEMAND SIDE OF THE EQUATION
Supply is only a drag when it is handily outpacing demand; so, is it simply investors becoming overzealous about the return prospects of development that created today’s conditions—or has something in the demand side of the equation changed since those shovels first broke ground?
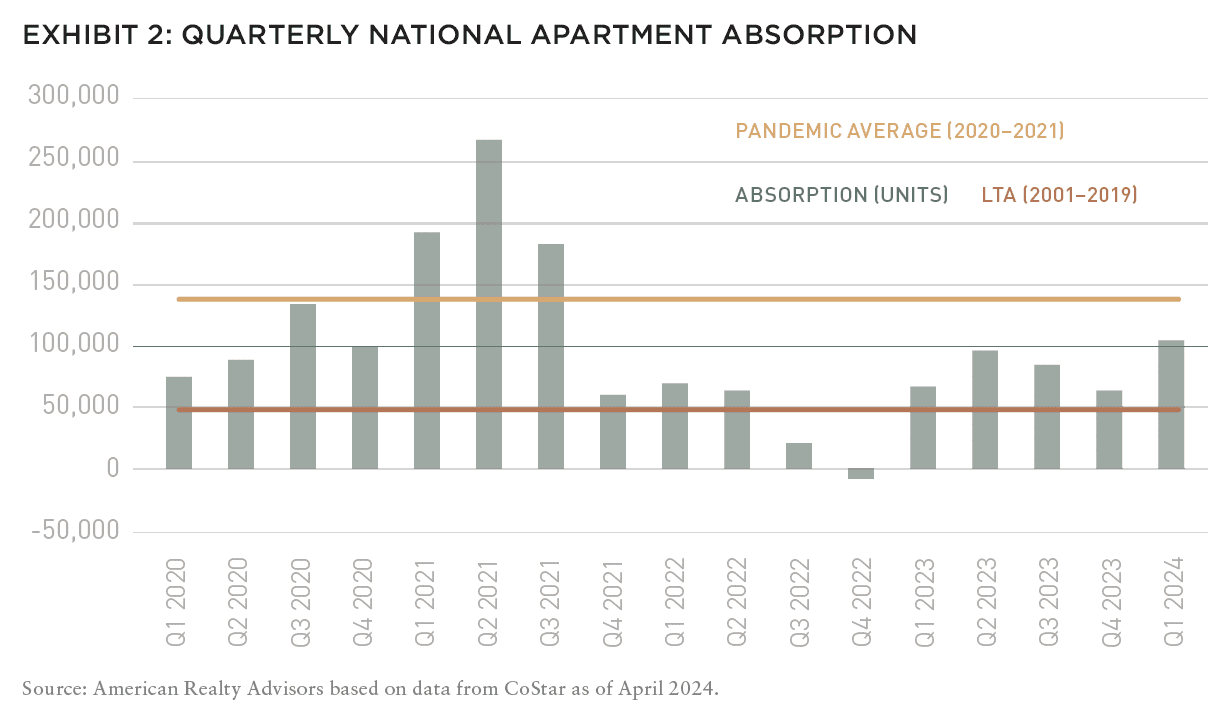
Quarterly demand over the last eighteen months has averaged roughly 70,000 units nationwide, firmly above the pre-pandemic long-term average of around 50,000 units. From a historic perspective, this recent period has been a very robust one in terms of absorption. However, it is likely that the current supply wave is in direct response to the staggering 137,500 units per quarter that were being absorbed in 2020-2021, which was nearly three times the long-term average—and below which recent figures have fallen short by nearly half (Exhibit 2).
The explanation for the recent moderation is relatively straightforward in that the initial impetus of young adults to uncouple from parents and roommates was strongest in the earlier days of the pandemic and has since normalized.
RENTS AND RETURNS
The result of the present supply-demand mismatch has been a thirty-month stretch of declining national occupancy and anemic rent growth. According to CBRE-EA, same-store rent growth for 2023 was just 0.4%, the lowest annual rent increase (absent the decline in 2020) since the GFC and a whopping 12.9% deceleration from the breakneck pace we experienced in 2021. The pace of rent growth in 2023 is all the paltrier when viewed through the lens of overall inflation, which saw the all-item CPI increase 3.4%, meaning that “real” rent growth was decidedly negative.
Declining occupancies and rents have dragged on apartment operating revenues, which, in combination with rising expenses and a less-favorable capital markets backdrop, have spurred what is currently five (Q4 2022–Q4 2023)—and is likely to be at least six—consecutive quarters of negative total returns for the NCREIF Property Index apartment sub-index.3
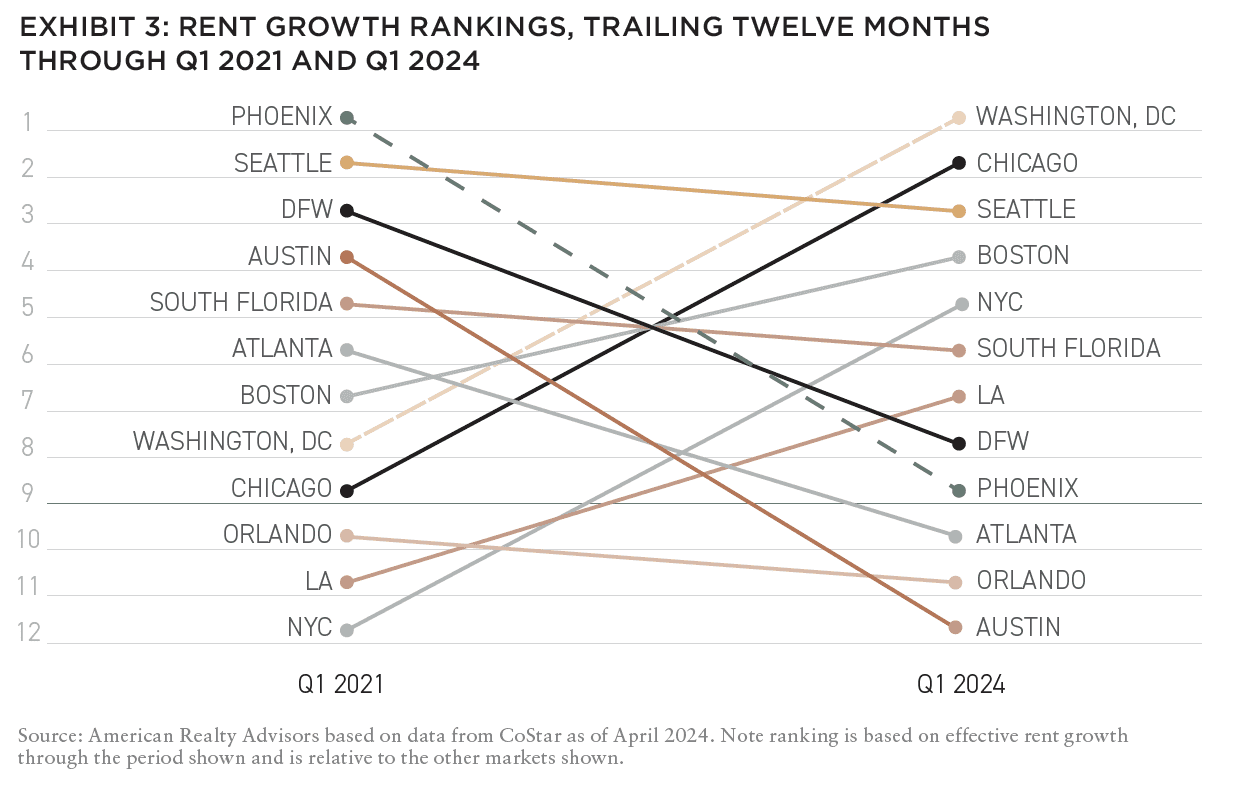
While all markets have seen fundamental strength moderate from pandemic highs, the distribution of outcomes—from downright contraction to modestly expansive—varies by market. Not surprisingly, Sun Belt markets, whose lower land costs and relatively fewer supply barriers allowed for more vigorous supply in the first place, today show the weakest rent growth and returns. Alternatively, East and West Coast metros where rent growth slowed over the past few years are now the relative beneficiaries of considerably lower supply and are likely to experience higher year-over-year rent growth than the Sun Belt (Exhibit 3).
CAPITAL MARKET IMPLICATIONS
Declining occupancies and more subdued rent growth prospects are adding further strain to owners’ refinancing prospects. Loans maturing over the coming few years (to the tune of $645 billion between 2024 and 2026) face considerably higher rates than when they were originated. In isolation, this would simply mean setting aside more of a property’s income to cover the increase in the debt servicing costs, but the timing of this particular bout of cyclical weakness means that new loan costs will be elevated, but the operating revenues available to support these higher costs will be diminished.
In some cases, this shrinking of the denominator and expansion of the numerator may lead to an unserviceable debt load. It is this scenario where potential distress (and a resulting swath of opportunities to capitalize on fire sales) stands poised to materialize in a very real way.
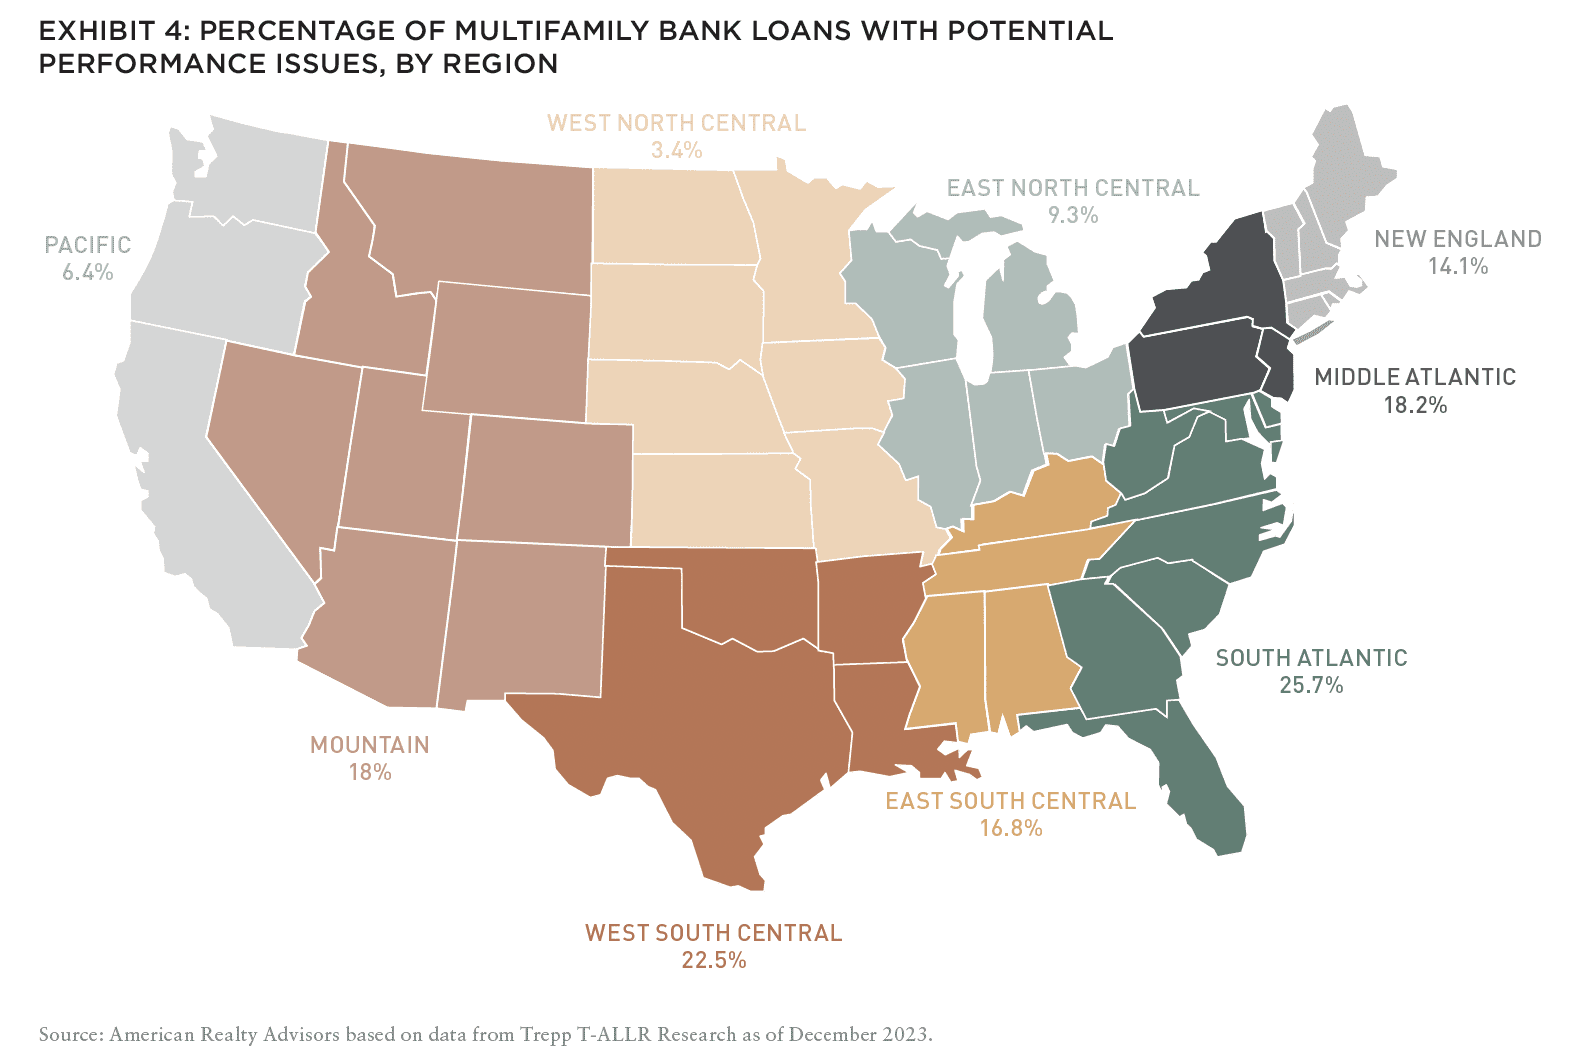
However, just as fundamentals are not universally impacted to the same degree nationwide, potential distress also varies by region and market. Regions that have experienced significantly greater levels of new development, such as the Sun Belt, are likely to encounter more distress, as the ongoing influx of supply suppresses rent growth and thus challenges cash flows more meaningfully (Exhibit 4). Markets such as Atlanta and Dallas-Fort Worth, with sizable maturity pools of $34.9 billion and $26.6 billion respectively, are likely to experience the most distressed opportunities.4
Though distress is rarely a good thing, these conditions offer a silver lining for well-capitalized investors seeking to acquire assets at prices well below today’s replacement costs. Having a strategic roadmap for identifying where there is a disconnect between asset-level capital stack distress and submarket fundamentals should offer a unique arbitrage advantage.
DIG DEEPER TO SEE OPPORTUNITIES BEYOND THE MARKET NARRATIVE
An all-too-common trap investors can fall prey to in environments like today is assuming that market-level narratives apply to all neighborhoods or geographies within those markets. That is, investors may miss opportunities in specific sub-markets (i.e., neighborhoods) because the broader fundamentals in the larger markets may appear weak in aggregate. Taking a more granular approach to geographic selection can help uncover attractively mispriced investment opportunities.
Austin is a great poster child for this phenomenon. The title of a recent Wall Street Journal article referenced how once America’s hottest housing market is now running in reverse, noting that apartment rents in Austin “have fallen more than anywhere else in the country, after a period of overbuilding and a slowdown in job and population growth.”5 The 7% year-over-year decline in rents recorded through February 2024 (more than any other metro in the country)6 has coincided with a dramatic decline in transaction activity, which was down 47% year-over-year in the year to date through February (whereas national volumes for the same period were down 32%).7 The about-face in Austin apartment fundamentals has prompted investors to move away from the market more meaningfully than elsewhere in the country, leaving a relative liquidity vacuum in their wake.
EXPLORE THE NEW ISSUE

NOTE FROM THE EDITOR: WELCOME TO #15
Benjamin van Loon | AFIRE
MID-YEAR CRE MARKET OUTLOOK: AFIRE
Benjamin van Loon and Gunnar Branson | AFIRE
MULTIFAMILY OUTLOOK: AMERICAN REALTY ADVISORS
Sabrina Unger and Britteni Lupe | American Realty Advisors
MULTIFAMILY GAP CAPITAL: BARINGS REAL ESTATE
Dags Chen, CFA and Lincoln Janes, CFA | Barings Real Estate
SINGLE-FAMILY RENTAL OUTLOOK: CERBERUS CAPITAL MANAGEMENT
Kevin Harrell | Cerberus Capital Management
SINGLE-FAMILY RENTAL SUPPLEMENT: YARDI
Paul Fiorilla | Yardi
LOGISTICS OUTLOOK: BRIDGE INVESTMENT GROUP
Jay Cornforth, Jack Robinson, PhD, Morgan Zollinger, and Cole Nukaya | Bridge Investment Group
DATA CENTER OUTLOOK: PRINCIPAL ASSET MANAGEMENT
Casey Miller and Ben Wobschall | Principal Asset Management
SELF-STORAGE OUTLOOK: HEITMAN
Zubaer Mahboob | Heitman Europe
COLD-STORAGE OUTLOOK: NEWMARK
Lisa DeNight | Newmark
OFFICE OUTLOOK: CUSHMAN & WAKEFIELD
David Smith | Cushman & Wakefield
RETAIL OUTLOOK: MADISON INTERNATIONAL REALTY
Christopher Muoio | Madison International Realty
HOSPITALITY OUTLOOK: JLL
Zach Demuth | JLL
+ LATEST ISSUE
+ ALL ARTICLES
+ PAST ISSUES
+ LEADERSHIP
+ POLICIES
+ GUIDELINES
+ MEDIA KIT (PDF)
+ CONTACT
While the market’s challenges are not considered by these authors to be overstated, there are pockets of relative strength. One way to identify where those pockets are is to evaluate how close or far an area is from equilibrium by calculating the demand multiple of completions, which is simply a ratio of absorption relative to supply. The closer to or above one the ratio, the more balanced or landlord-favorable conditions should be. The lower/more negative, the less compelling.
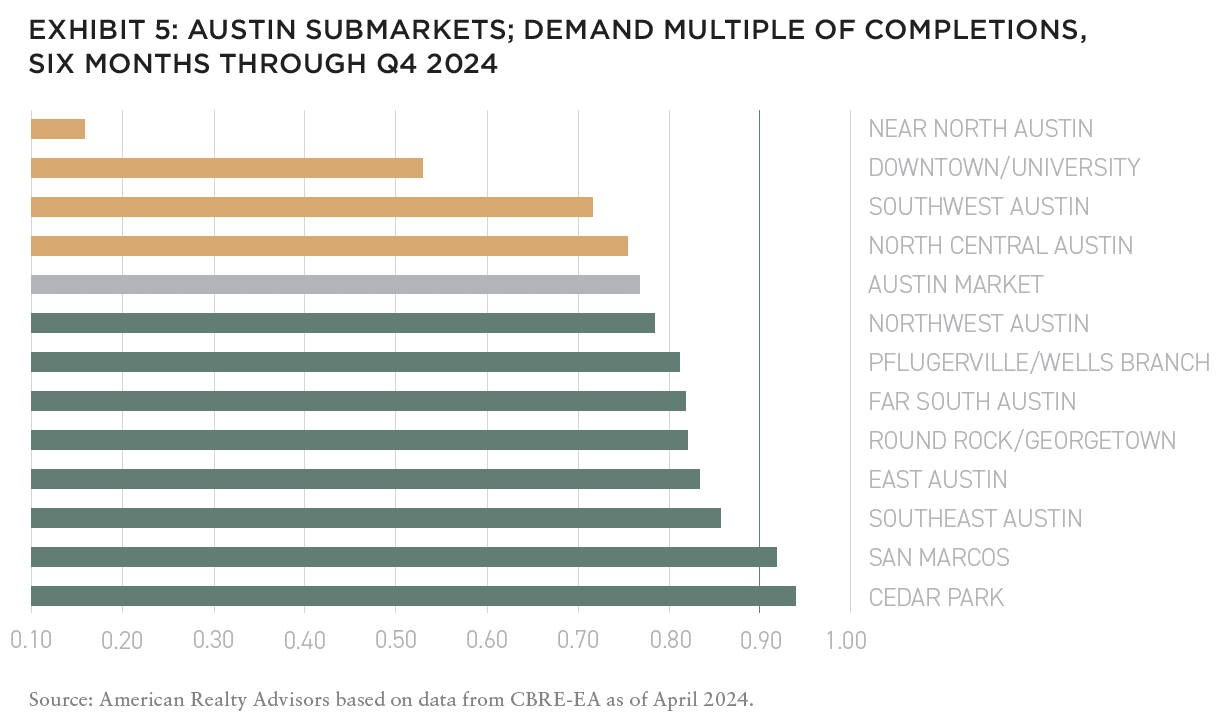
In Austin, the overall market ratio in H2 2023 stood at 0.77, meaning cumulative supply outpaced absorption by around 23%. Yet as Exhibit 5 shows, there are actually more submarkets whose ratio is better than the market average, and in certain pockets, such as southeast Austin, San Marcos, and Cedar Park, the degree to which supply outpaced absorption during the period was a considerably less-concerning +/-10%.
This same nuance exists in every market nationwide. For strategies that are more dialed into hyper-local dynamics, these differences are expected to outperform others that paint whole markets with too broad of brushstrokes, but also allow for very targeted acquisition activity when distressed deals pop up.
INCORPORATING MARKET SHIFTS INTO STRATEGY
Today’s conditions prove that the multifamily sector is not bulletproof and the importance of basics like supply and demand cannot be overstated. But recall the latest data reflected in Exhibit 1: 81% of developers, even today, are continuing to experience delays. Multifamily starts dropped 43.7% in March 2024 compared to the same period one year prior.8 Multifamily permitting, a leading indicator of supply, has also moved into sharp decline, down an average of 28% year-over-year over the last consecutive four quarters.9
A forthcoming pullback in new inventory amidst what is expected to be sustained, albeit more normalized, levels of demand should help move fundamentals nearer to equilibrium in due course.
While this is encouraging and sets up the multifamily sector for long-term performance, it likely isn’t to come soon enough for those owners whose loans are coming due amidst peak cyclical weakness.
According to one estimate, more than $20 billion of apartment complexes purchased in the last three years are potentially distressed, with the total more than triple that amount when accounting for buildings that hadn’t sold during that window.10 For investors with return horizons that extend beyond 2025, the ability to anticipate fundamental improvement should drive conviction in taking advantage of today’s distressed buying opportunities. This is especially true for investors whose managers take a granular approach to asset and submarket selection.
As a popular adage goes, “Cap rates are temporary. Basis is forever.”11
—
NOTES
1. Case-Shiller US National Home Price NSA Index; as of March 26, 2024.
2. Bankrate analysis using Redfin median sale price; data as of April 1, 2024.
3. NCREIF Property Index; as of May 2024. Opinion on 2Q 2024 apartment total returns reflect those of the author at the time of this writing.
4. Barragán, Bianca. “$525B In Multifamily Loan Debt Set To Mature In The Next Five Years.” Bisnow, March 14, 2024. https://www.bisnow.com/national/news/multifamily/apartment-loans-maturing-yardi-matrix-123339.
5. Parker, Will. “Once America’s Hottest Housing Market, Austin Is Running in Reverse.” Wall Street Journal, March 18, 2024. Accessed May 24, 2024. https://www.wsj.com/economy/housing/once-americas-hottest-housing-market-austin-is-running-in-reverse-94226027.
6. Apartment List; data as of February 2024.
7. Real Capital Analytics; as of April 2024.
8. FRED St. Louis; as of April 2024.
9. “Monthly New Residential Construction, April 2024.” Census.Gov, May 16, 2024. Accessed May 24, 2024. https://www.census.gov/construction/nrc/pdf/newresconst.pdf.
10. MSCI Real Assets
11. Mark Allen on X (formerly Twitter), March 25, 2023.
—
ABOUT THE AUTHORS
Sabrina Unger is Managing Director, Research and Strategy, and Britteni Lupe is an Assistant Vice President, Research and Strategy, for American Realty Advisors, a provider of commercial real estate investment management services with $11.5 billion AUM.
—
THIS ISSUE OF SUMMIT JOURNAL IS GENEROUSLY SPONSORED BY
Founded in 1992, Cerberus is a global leader in alternative investing with approximately $65 billion1 in assets across complementary credit, private equity, and real estate strategies. We invest across the capital structure where our integrated investment platforms and proprietary operating capabilities create an edge to improve performance and drive long-term value. Learn more.

Principal Real Estate is the dedicated real estate investment team of Principal Asset Management, the global investment solutions business for Principal Financial Group®. As a top 10 global real estate manager, with over $98 billion in assets under management and more than 60 years of experience, we provide clients with access to opportunities across both public and private equity and debt. Learn more.