Since the start of the pandemic, it has become a common refrain in the real estate conference circuit that “office is the new retail.” It is easy to see why; office has seen profound disruption from higher adoption rates of remote working, similar to the disruptive impact of e-commerce on retail.
While the comparison seems straightforward at first blush, there are some fundamental differences between the property types. To our knowledge there has been little systematic research comparing the post- GFC disruption in retail to that of office post-pandemic.
This article provides a structured framework and some analytical categories to the comparison. We juxtapose retail against office for the supply response post-disruption, experience with the disruptive trend, capital flows, property performance by location, and changes in relationships with key economic variables post-disruption. In doing so, we hope to shed light on how instructive the comparison between property types is and offer a guide to where office might go next.
THE CURRENT STATE OF PLAY: RETAIL UP, OFFICE DOWN
The contrast between office and retail is particularly stark today because of their recently diverging fortunes. After years of combatting oversupply, a narrative that brick-and-mortar retail was dead, and the unrelenting growth of online shopping, retail is having its day in the sun again (Exhibit 1).
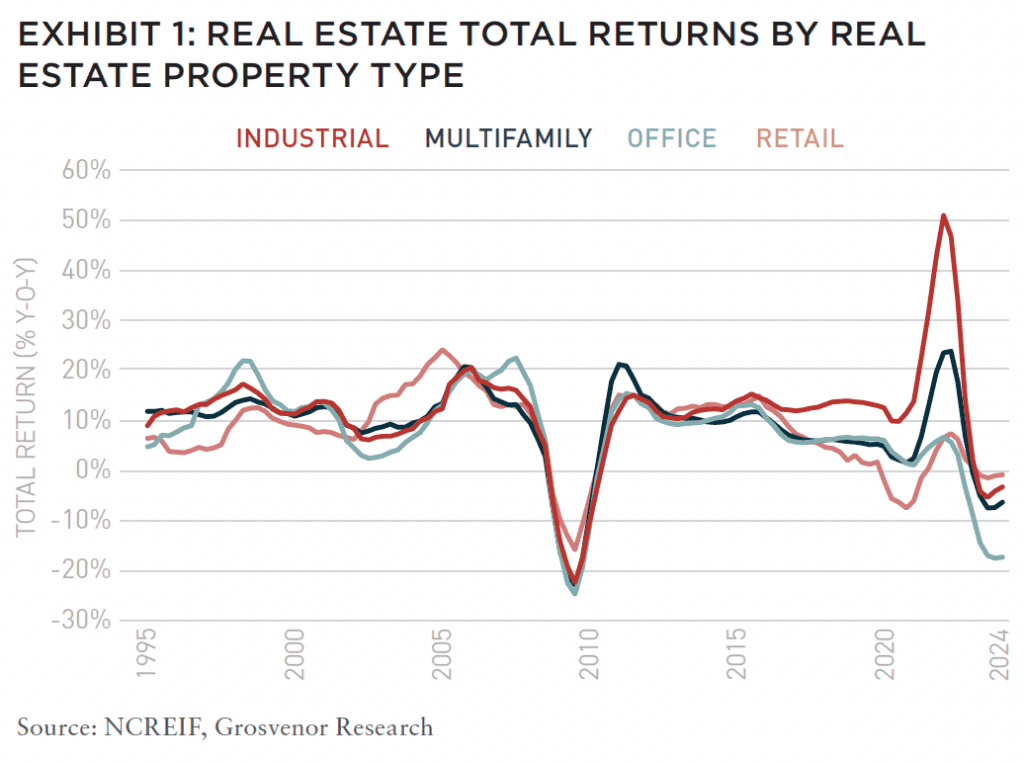
Total returns for all major property types dipped into the negative over the last year, driven lower by a combination of higher interest rates, rising vacancy, and changes in supply. While retail total returns have been marginally negative over the last year at around -1% year-over-year, it remains the best performing major real estate property type. In fact, the last year has been the longest stretch of retail total return outperformance since the GFC, when retail proved to be quite defensive in the downturn. Office, by contrast, has seen a sharp fall, with total returns averaging -17% year-over-year.
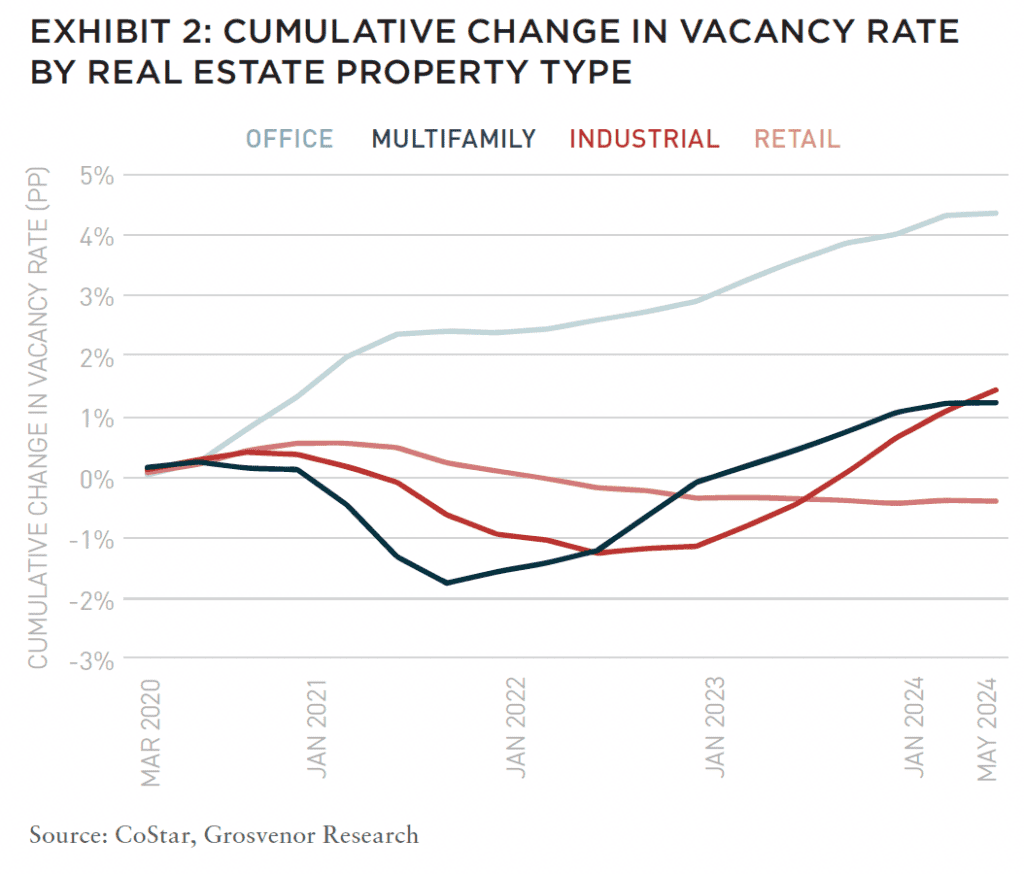
Retail’s relative outperformance is also apparent when looking at vacancy. Exhibit 2 shows the cumulative change in the vacancy rate across major commercial real estate property types. Retail saw a modest rise in vacancy at the beginning of the pandemic, but to date it is the only major property type in which vacancy today is lower than it was at the start of 2020. Office vacancy, by contrast, has steadily increased over that period, by over four percentage points. Even multifamily and industrial have seen some rise in vacancy due to the development boom over the course of the pandemic.
SUPPLY: RETAIL AND OFFICE ADJUSTMENTS IN THE 2010’S
Retail started oversupplied post-GFC, and the increase of available space per capita, in conjunction with the move to online shopping, eroded returns in the sector.
Indeed, by global standards the US had one of the largest retail-space-per-capita footprints globally. But following the GFC, total retail inventory grew 0.6% per annum, as did office.
The US population grew 0.7% per annum over that same period, so inventory per capita in both retail and office shrank. Furthermore, retail and office space grew much slower than multifamily (1.8% per annum) and industrial (1.1% per annum).
It is helpful to zoom in on major urban metros, since these markets tend to be more liquid with more institutional-grade stock than the US as a whole. We examined a sample of thirty major US markets to highlight urban retail trends.1
In these markets, retail stock grew only 0.6% per annum from 2008 to 2023 while office inventory grew 0.9% per annum over the same period. For context, population growth was 1.0% p.a. during this time.
The divergence of retail and office inventory did not occur immediately following the GFC. It only began in the mid-2010s, when office development grew but retail development stagnated by comparison. This has continued through to today, although the gap has narrowed post-pandemic.
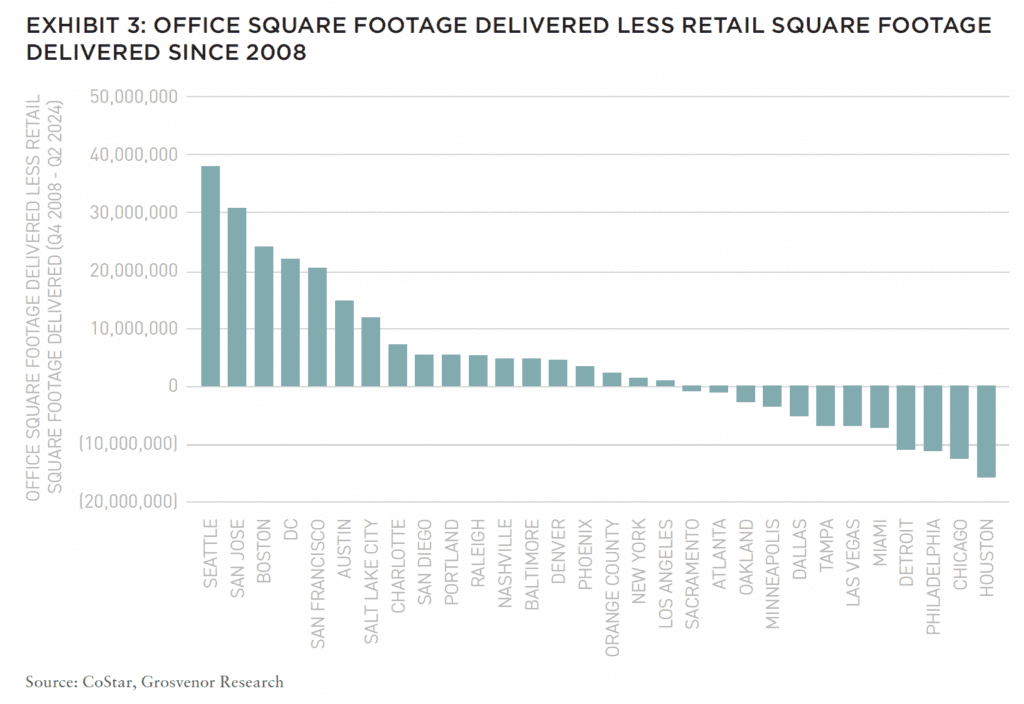
That is not to say that office space grew faster than retail space everywhere. Since 2008 in this thirty-market set, developers delivered 125 million more square feet of office than retail. But some markets, ranging from Chicago to Miami to Minneapolis, saw more retail space deliver than office (Exhibit 3).
DISRUPTED FAST AND SLOW
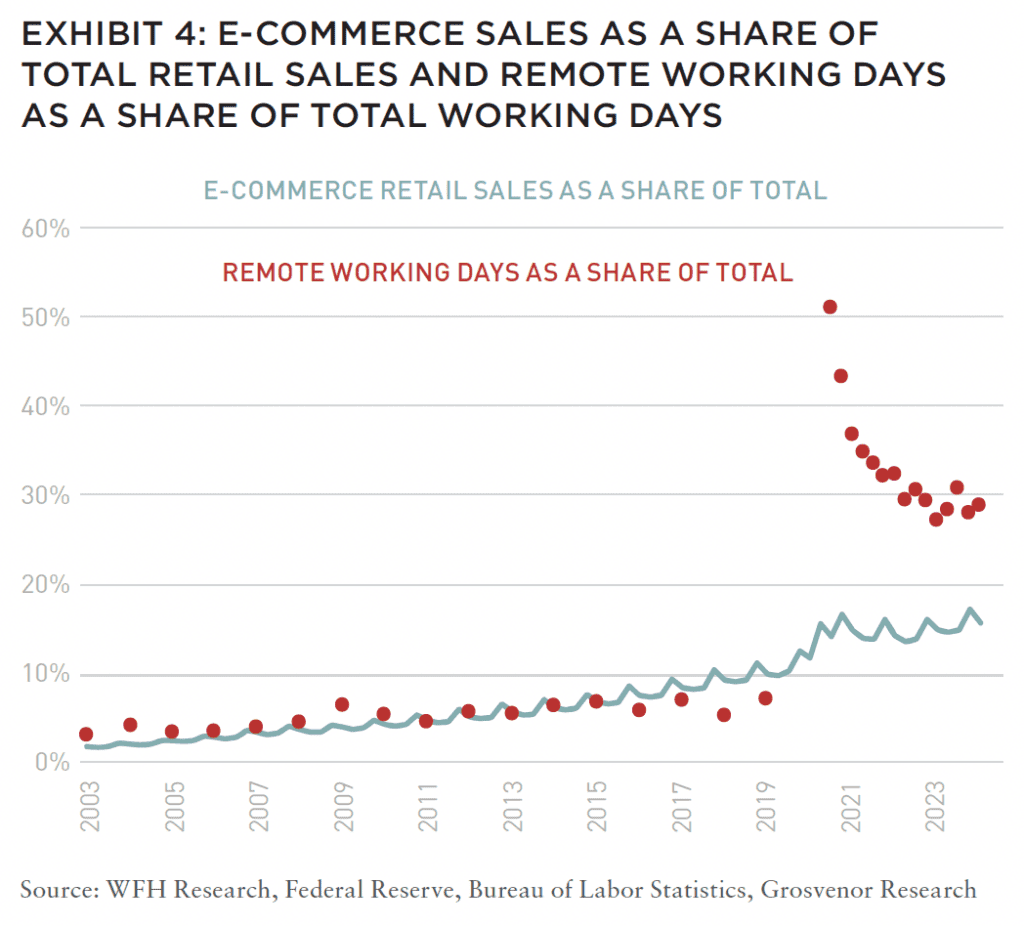
The divergence of office and retail development in major urban metros appears to be a function of, and response to the major disruptive events the product types experienced. The disruption of retail by e-commerce happened slowly but steadily (Exhibit 4). At the beginning of 2003, e-commerce sales were 1.7% of total retail sales. Remote working incidence was near double that, comprising 3% of total working days. In 2009, during the GFC, both trends had more than doubled with e-commerce sales representing 3.9% of total sales and remote working representing 6.4% of total working days.
In 2019, a decade later and the last full year before the pandemic, retail sales had again grown significantly to around 10.5% of total sales. By contrast, remote work adoption had grown very little to 7.2% of total working days. The pandemic significantly reshaped e-commerce and remote work in dramatically short order. E-commerce sales went from 12.4% at the end of 2019 to 16.6% a year later. More dramatically, remote working climbed to 51% of total working days in the summer of 2020 and has settled around 28% today.
E-commerce disrupted retail in a slow and steady fashion. The fact that new retail construction, total returns, and capital flows did not noticeably slow until the mid-2010s suggests that it took time for investors to adjust to the impact of e-commerce on bricks-and-mortar as the key real estate play linked to domestic consumption.
To contrast, office has been disrupted in an instantaneous and dramatic fashion. Decades of remote work adoption and development of the technologies advanced seemingly overnight. As a result, the market response to disruption in office has been far more immediate.
FOLLOW THE MONEY
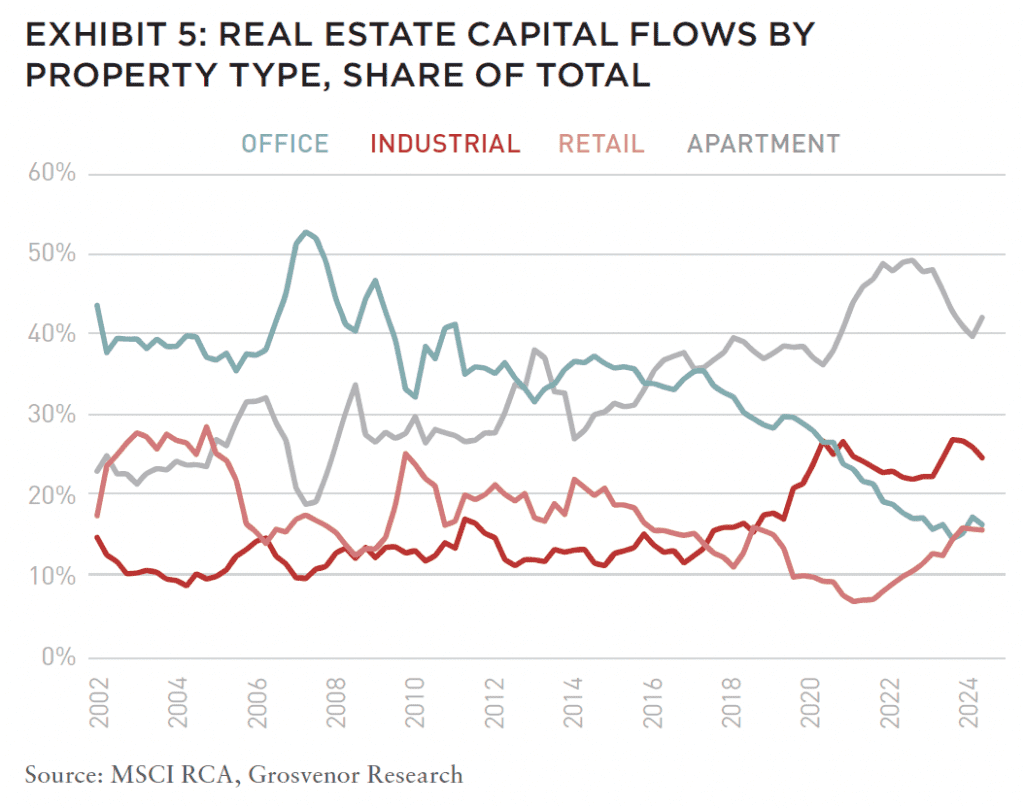
The mid-2010s slowdown in retail is also apparent in capital flows data. Exhibit 5 shows capital flows among major real estate property types as a share of total real estate capital flows. In the early 2000’s, office was the most popular property type among institutional investors, followed by retail and multifamily.
After the GFC, both retail and office’s share of total retail transactions trended downward. There was no significant difference in their path of travel, just their relative magnitude.
That near-parallel movement changed in 2021, where retail enjoyed a resurgence among investors, representing 7% of total transactions in early 2021 compared to 16% today. Office moved in the other direction with its decline accelerating. Remarkably, the level of office transactions has dropped and is on par with retail for the first time on record.
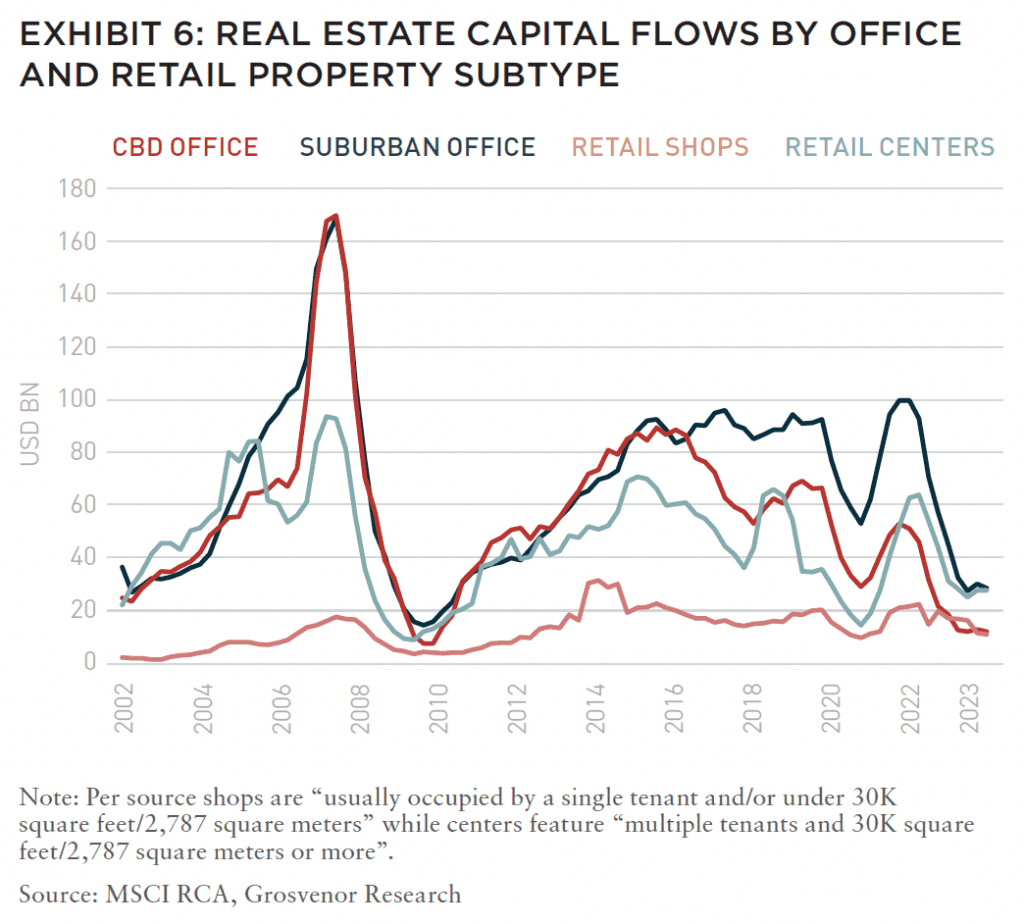
Breaking down transactions into major subcategories (Exhibit 6), two things become clear. First, the slowdown in office transactions starting in the mid-2010s was exclusively in CBD office locations, with suburban office transactions holding up relatively well.
Second, suburban office transactions followed urban office declines post-pandemic to the point where the value of total suburban office transactions are nearly the same as retail centers. Urban office transactions have declined so precipitously as to be comparable with the historically smaller retail shops segment.
LOCATION, LOCATION, LOCATION
How did retail perform by location, and should we expect office to perform similarly?
Exhibit 7 shows the average national retail rent growth over the last two decades by location from pre-GFC to post-pandemic. The last time suburban retail experienced growth was the pre-GFC era, just as e-commerce was on the rise. It would not be until the pandemic and the emergence of remote work when suburban retail would outperform with rent growth averaging 4% p.a. This differs from CBD retail, which outperformed during the post-GFC era.
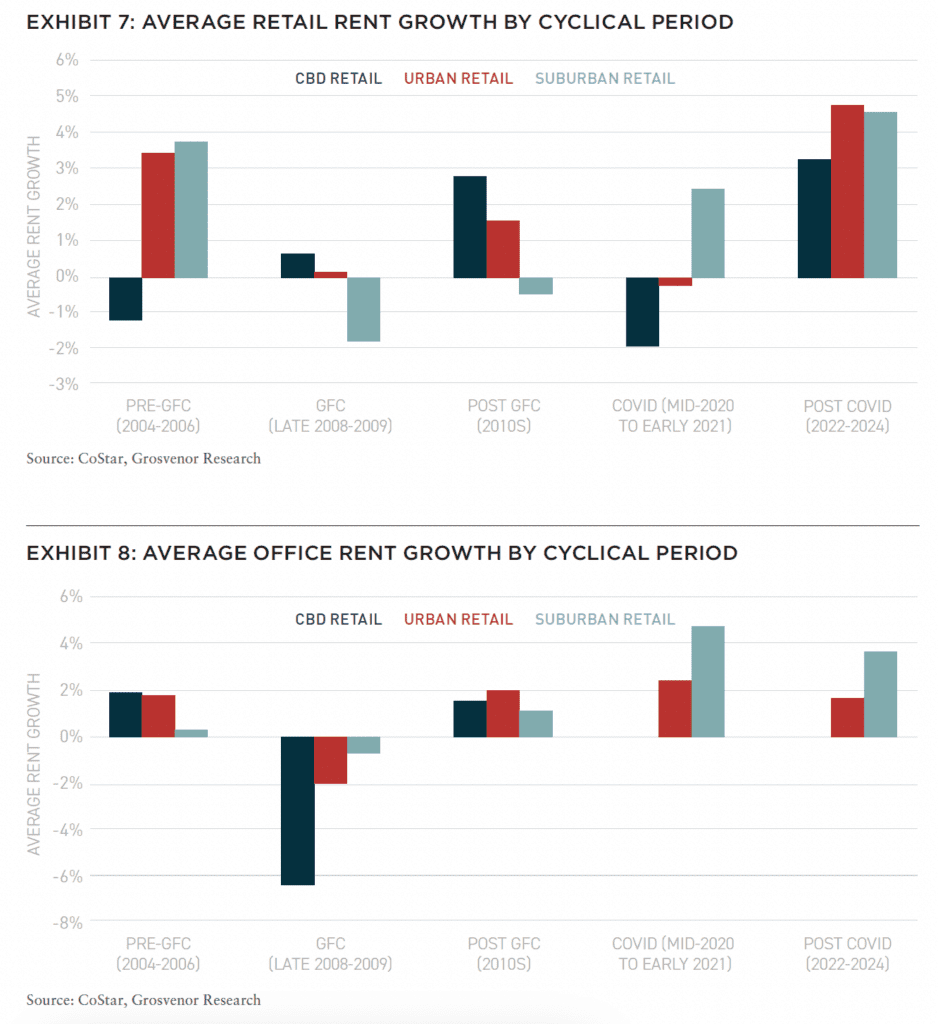
Exhibit 8 shows office rental growth over the same time periods. With remote work stabilizing around 28% of working days, suburban offices nearer to residential areas are now outperforming. Demand for office space followed as workers fled to the suburbs during the pandemic while CBD’s have seen little to no growth. The only time CBD office outperformed was in the pre-GFC period.
Both suburban office and retail property types have benefited from the rise of suburbs which is a structural, not cyclical, shift.
BREAKDOWN OF HISTORIC RELATIONSHIPS
Traditional indictors of future returns may not be as reliable as they once were. Exhibit 9 shows a scatter plot of retail total returns and retail sales growth from the early 1990s to early 2024. The green dots cover the pre-GFC period, and the purple dots cover the post-GFC period.
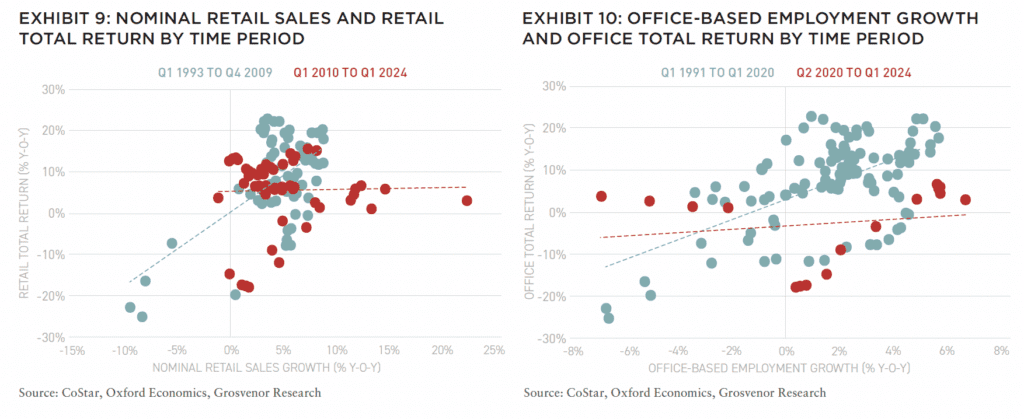
Traditionally, there was a clear causal relationship between sales growth and total return as robust sales allowed for rental growth and, in the case of turnover leases, higher NOI. This relationship remained until the rise of e-commerce. The purple dots show the era of e-commerce with a much weaker correlation. Consumers increasingly began shopping online so while sales growth increased, this did not directly translate into more demand for retail space.
A similar situation arises in the relationship between office using employment and total returns, shown in Exhibit 10. Here, the green dots show the pre-pandemic period, and the purple dots show the post-pandemic period. Job growth in office-using sectors would lead to higher returns as more workers translated to office space demand. This was the prevailing relationship from the early 1990s up until the pandemic. After the pandemic, this relationship appears to have weakened, although it is hard to draw a firm conclusion with so few data points. As more firms adopt hybrid working models, we expect office employment growth to have a weaker relationship with office total returns.
NEW: SUMMIT #16

NOTE FROM THE EDITOR: ISSUE #16
Benjamin van Loon, CAE | AFIRE
GLOBAL CONSUMPTION: APAC DATA CENTER INVESTMENT STRATEGIES IN THE AGE OF DIGITIZATION
Michelle Lee, Eugene Seo, and Wayne Teo | CapitaLand Investment
DISTINCT VERTICALS: AI IS CHANGING THE REAL ESTATE INDUSTRY ON TWO DISTINCT PATHS
Daniel Carr and Andrew Peng | Alpaca Real Estate
DIVERGING FORTUNES: ARE COMPARISONS BETWEEN OFFICE AND RETAIL STILL WARRANTED?
Brian Biggs, CFA and Ashton Sein | Grosvenor
OCCUPYING FORCE: INSTITUTIONAL OFFICE PROPERTIES FEELING THE PAIN
Nolan Eyre, Scot Bommarito, and William Maher | RCLCO Fund Advisors
VALUE-ADD VS. CORE: COMPARING CORE AND NON-CORE STRATEGIES WITH NEW DATA
Yizhuo (Wilson) Ding | Related Midwest and Jacques Gordon, PhD | MIT Center for Real Estate
FAVORABLE CONDITIONS: STRUCTURAL CHANGES TO THE MARKET FAVOR NONBANK CRE LENDERS
Mark Fitzgerald, CFA, CAIA, and Jeff Fastov | Affinius Capital
INFRASTRUCTURE VIEWPOINT: INTEREST RATE CHANGES COULD UNLOCK NEW INFRASTRUCTURE INVESTMENTS
Tania Tsoneva | CBRE Investment Management
MISSING MIDDLE: WORKFORCE AND AFFORDABLE HOUSING IN THE US
Jack Robinson, PhD and Morgan Zollinger | Bridge Investment Group
NARROW SPACES: CHOKED STRAITS AND IMPLICATIONS FOR GDP, INFLATION, AND CRE
Stewart Rubin and Dakota Firenze | New York Life Real Estate Investors
OPCO-PROPCO OPPORTUNITY: EMERGING MODELS AND THE KEYS TO STRUCTURING PARTNERSHIPS
Paul Stanton | PTB and Donal Warde | TF Cornerstone
TRANSFORMING LUXURY: UNLOCKING VALUE IN LUXURY HOSPITALITY REAL ESTATE
Alia Peragallo | Beach Enclave and AFIRE Mentorship Fellow, 2024
SOLAR VALUATION: IS SOLAR ENERGY A VALUATION GAME-CHANGER?
David Wei and Michael Conway | SolarKal
GROUND LEVEL: THE CASE FOR GROUND LEASES AND LONG-TERM CAPITAL
Shaun Libou | Raymond James
LEGAL UPDATE / DRIVING FORCE: UNDERSTANDING SYNDICATED LOANS AND MULTI-TIERED FINANCING
Gary A. Goodman, Gregory Fennell, and Jon E. Linder | Dentons
LEGAL UPDATE / ENHANCED PROTECTION: LEVERAGING THE SAFETY ACT FOR ENHANCED LIABILITY PROTECTION IN REAL ESTATE
Andrew J. Weiner, Brian E. Finch, Aimee P. Ghosh, Samantha Sharma, and Sarah Hartman | Pillsbury
+ EDITOR’S NOTE
+ ALL ARTICLES
+ PAST ISSUES
+ LEADERSHIP
+ POLICIES
+ GUIDELINES
+ MEDIA KIT
+ CONTACT

ABANDONING THE MISCONCEPTION
“Office is the new retail” is ultimately an imperfect comparison. We expect new office development to slow in response to changes in demand, as retail development did in the mid-2010s. For now, capital flows into office have dried up and historic relationships with key bellwether indicators in the sector, such as office-using employment growth, appear to have changed. This rhymes with the post-GFC retail experience, when investor interest in the sector started to waver and retail real estate’s relationship with retail sales weakened as more sales shifted online.
Other factors are different. Retail saw urban property outperform following the GFC, but urban office is in a challenging spot with such high vacancy that it is difficult to see urban office outperformance on the horizon. Locational relationships seem to be less about cyclical experiences and more about the structural shift towards remote work adoption—settling around five times higher than it was before the pandemic. And because office’s disruption has been sudden and tumultuous, compared with retail’s gradual and steady disruption, there’s still a material amount of uncertainty over how the right-sizing process in office will play out.
Just as retail is enjoying a bounce back in investor interest and performing at the top of the total return league table, office will eventually have its time again. The low-growth right-sizing process will be tricky to navigate and its anyone’s guess as to how long the process will take. Retail is a good guide in some regards, but a poor guide in others. As ever, pithy but half-baked analogies are no substitute for proper analysis.
—
NOTES
1. These metros are Atlanta, Austin, Baltimore, Boston, Charlotte, Chicago, Dallas, Denver, Detroit, Houston, Las Vegas, Los Angeles, Miami, Minneapolis, Nashville, New York, Orange County, Philadelphia, Phoenix, Portland, Raleigh, Sacramento, Salt Lake City, San Diego, San Francisco, San Jose, Seattle, Tampa, and Washington DC.
2. Green dots are periods from Q1 1993 to Q4 2009; Purple dots are periods from Q1 2010 to Q1 2024
3. Green dots are periods from Q1 1991 to Q1 2020; Purple dots are periods from Q2 2020 to Q1 2024
—
ABOUT THE AUTHORS
Brian Biggs, CFA is Vice President of Research and Strategy for Grosvenor. Ashton Sein is a Senior Research Analyst for Grosvenor.
—
THIS ISSUE OF SUMMIT JOURNAL IS GENEROUSLY SPONSORED BY
Leverage the only investment management suite that automates complex processes and ensures transparency from investor to asset operations, integrating investment and debt management, capital raising, investment, financial, and operational metrics through a branded investor portal. Learn more.
