
The housing affordability in the US is now near its lowest levels since the early 1980s.
It was already a major challenge before the pandemic but has become more acute since then.
Home prices grew by more than 50 percent over the last five years—twice as fast as household incomes and rents.
The key reason behind this is a severe national shortage of housing which is likely to persist for years.
One of the major implications of this imbalance is the continuing upward pressure on housing costs that will likely keep contributing to consumer price inflation (CPI) beyond the immediate horizon. Any viable long-term solution will require a combination of tax incentives and public-private partnerships at both the federal and local levels to significantly boost housing production and start closing this demand/supply gap. From the market fundamentals perspective, attainable housing will continue to present a broad spectrum of investment opportunities.
Estimates of the current US housing shortage vary from one to three million units for the base figures, to four to five million units when adjusting for quality of the underlying inventory (including obsolescence), to more than seven million units when further adjusting for the needs of low/middle-income households.[1]
While the range of estimates is very wide at the surface, a closer review of (1) what each estimate measures, (2) what assumptions underlie the calculations, and (3) an exploration of these same data sources shows that the range of differences are not as extreme. The main considerations for such comparisons are whether one includes seasonal homes and units held off market in the calculations, and whether one makes any additional assumptions with respect to the housing quality and affordability. Adjusting supply shortage for obsolescence and affordability certainly makes it far deeper than its base figures that this viewpoint focuses on.
WHERE IS THE HOUSING SHORTAGE?
There are two basic approaches to estimating housing shortage and both produce very similar sets of results. The first approach is to look at the total housing demand as measured by the reported number of households (or occupied units) relative to the number of households that would be expected based on the long-term trend. When the number of households is above the trend, it typically suggests a supply surplus (all else being equal), and when it is below the trend, it points to a supply deficit.
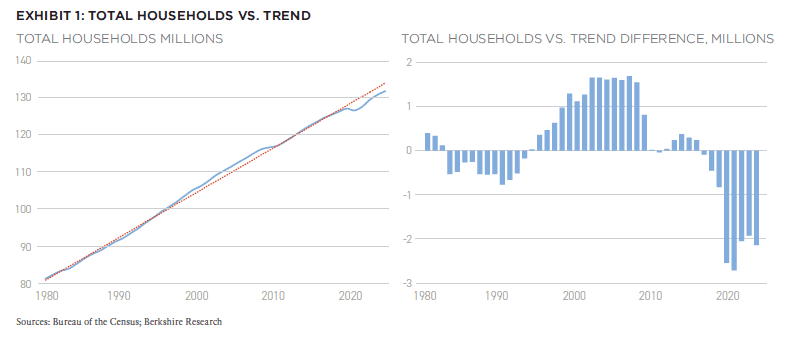
Exhibit 1 illustrates the results based on the first approach. According to a recent Housing Vacancies and Homeownership Survey (HVS), there were 132.1 million households nationally—which is 2.1 million below where that figure would be expected to be based on the long-term trend.[2]
With the annual demand resulting from obsolescence and demolitions being around 400,000 units, this suggests current total pent-up housing demand (or, conversely, supply shortage) of 2.5 million units. Almost half of these “missing” households are, historically, young adults who tend to rent.
As of 2023, 24.4 million people ages 18 to 34 still lived at home with their parents; that is more than 32% of the total in that cohort (75.3 million). Historically, that share is about 28% and the 4% difference between the current share and its long-term average is equivalent to about 2.5 million people aged 18-34; or about a million households, given the average number of people per household in that group. The key reason why more young adults are living with parents is the severe affordability constraints on being able to form their own household. And the key factor driving housing costs so high is there is not enough housing to meet the demand.
The second approach to estimate housing shortage looks at supply rather than demand, which provides a more detailed answer, because it allows us to understand not only the aggregate housing imbalance, but also how it is distributed across various market segments (year-round versus seasonal housing), intended tenure (for-sale versus For-rent), property sub-types (single-family versus multifamily), and geographic areas. The data available for such analyses are far from perfect, with margins of errors in quarterly surveys reaching hundreds of thousands of housing units. Despite this, HVS is still the only historically consistent and high frequency source that helps shed some light on these questions by looking at housing shortage (or surplus) as a function of housing vacancy.
UNDERSTANDING VACANCY
The very notion of a housing shortage may sound surprising when millions of housing units are vacant at any time. More specifically, the Q3 2024 HVS report shows there are now 14.92 million vacant housing units comprised of 11.53 million year-round and 3.39 million seasonal units.
The year-round vacant category includes 5.3 million homes that are on the market and 6.2 million that are held off the market. Vacant homes that are on the market include 3.41 million for rent, 893,000 for sale, and 995,000 rented or sold and awaiting occupancy.
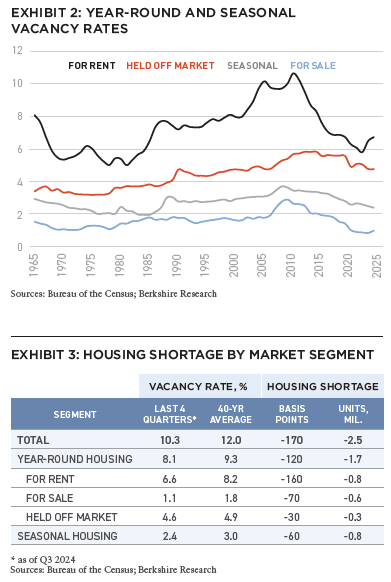
While these may seem like big numbers, they do not mean much unless they are expressed as vacancy rates or percentage shares of the corresponding inventories nd compared to some historical norms, which are usually approximated by long-term averages (Exhibit 2).
For the purposes of this analysis, we compare the current vacancy rates across various housing segments to their corresponding averages since the 1980s when HVS data starts to be continuously available by segment, units in structure, and geography.
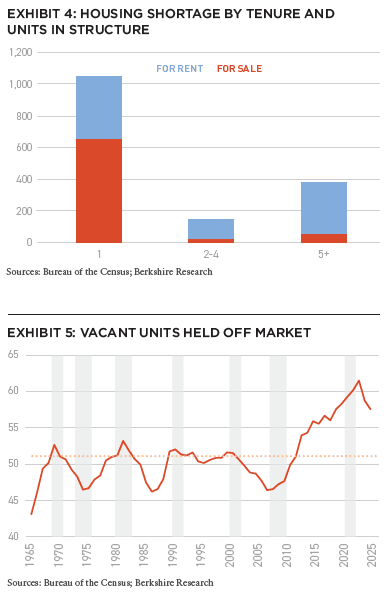
The differences between percentages are then multiplied by the current stock figures to be converted into units. The results of this approach show that the aggregate housing shortage is now 2.5 million units (Exhibit 3). This is the highest since at least the early 1980s (and likely longer), and the overall figure also matches the result from the first approach that focuses on demand rather than supply.
Most of the shortage is concentrated in year-round housing for rent and for sale which accounts for 1.5 million units, with more than half of it accounted by the single-family segment (Exhibit 4). The remaining shortage is accounted by seasonal and held-off market housing.
ALLEVIATING THE PROBLEM
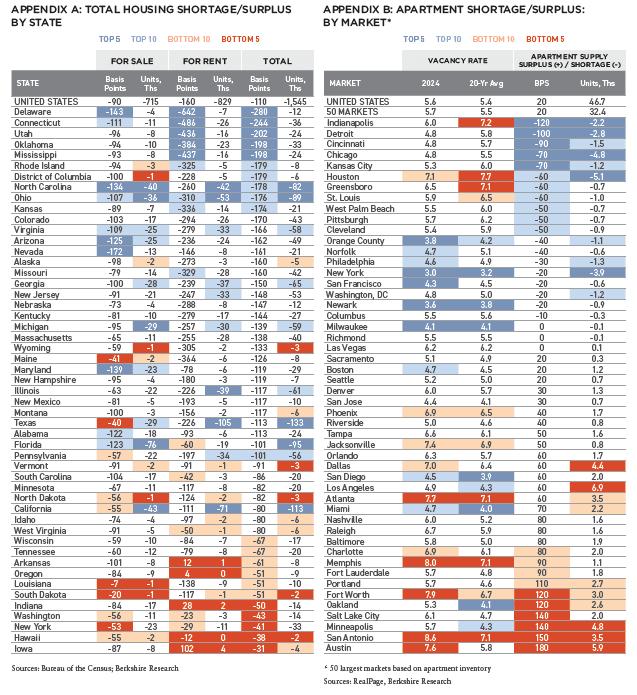
One potential source that could help alleviate the housing shortage are existing homes that are vacant but held off-market (Exhibit 5). This segment has always been and remains somewhat of a wild card as it tends to be dominated by homes purchased for investment purposes, as a non-primary residence, or for occasional use.
Nationally, vacant homes held off-market currently account for 4.3% of the year-round inventory, and this rate stands slightly below the long-term average. This said, these same homes now also account for 54% of all year-round vacant homes compared to 51% historically, and in absolute terms, this excess “shadow” vacant inventory is about 700,000 units.
In the past, the share of vacant homes held off market tended to fluctuate with economic and housing cycles. It was at its highest in 1969-70, 1980-82, 1990-91, and 2000-01—years immediately preceding or accompanying recessions.
The share was at its lowest during the recession of 1973-75 and the Great Recession; both periods being characterized by sharp, abrupt job losses and a high degree of financial distress, forcing many households to sell in an adverse market.
If the US housing market were to suffer a major correction (and aggregate oversupply would not be a contributing factor like the last time), we could see that share drop once again, thus helping balance the market somewhat.
Coincidentally, three key states currently experiencing acute housing shortages—Arizona, Florida, and Nevada—also traditionally happen to have the highest concentrations of homes that are held off market, which contributed to their home price and rent declines in the previous cycle.[3]
PERSISTENT SHORTAGES
Barring a severe recession with sharp job losses, the US housing shortage is likely to persist for years. The current annual pace of new residential supply (completions) is about 1.6 million units per year, which is barely enough to meet the baseline household growth assumption of 1.0-1.1 million (annual average of the last 10-20 years), plus replacement demand from obsolescence/demolitions of 400,000 units and additional demand for secondary/investment homes of 200,000 million units.
Unless there is a sudden contraction in household growth and/or an influx of held off-market homes, from a purely demand/supply perspective (i.e., keeping other factors such as wages/incomes and interest rates constant), the upward pressure on housing costs is likely to persist. Federal policies to spur more residential construction through tax credits or other incentives (especially for affordable housing) could help narrow the deficit, but that will still likely take years—and availability of land and local zoning restrictions will likely prove challenging. Incentivizing property owners to sell or rent vacant homes held off market can also be a questionable solution, considering that most of such inventory is concentrated at the higher end of the price spectrum, or far above the range that could be deemed “affordable.”
Aside from potential macroeconomic and policy implications of the current housing shortage, real estate investors and developers should also consider opportunities as well as risks created by this environment. First, the market clearly needs substantially more new housing for both renter and owner occupancy and in both single-family and multifamily segments. Our prior analysis based on other data sources strongly suggests that virtually all this new supply is needed in the middle and lower ranges of the price spectrum.[4]
Second, the shortage is concentrated in certain parts of the country and unevenly distributed not only across but also within regions and states, varying widely by market, submarket, and product. For example, while housing shortage is present everywhere, it varies from less than 0.5% of existing inventory in Washington, New York, Hawaii, and Iowa to more than 2% in Delaware, Connecticut, Utah, Oklahoma, and Mississippi (Appendix A). Among larger states, total housing shortage is more acute in Ohio, North Carolina, Virginia, Arizona, Nevada, Georgia, and New Jersey. Meanwhile, rental housing shortages also remain very tangible in Texas, California, and Illinois.
SURPLUS EXCEPTIONS
It is also worth noting that despite the aggregate housing shortages, some markets, submarkets, and product niches are facing temporary supply surpluses. These differences need to be evaluated carefully in the context of shifting demographics, including age, household size, income distribution, migration patterns, and so forth.
Rental multifamily with five or more units is a good test-case for this. Nationally, this segment is still undersupplied by about 300,000 units (Exhibit 4). At the same time, institutional-quality subset of rental apartments is currently oversupplied by 0.4%, or about 82,000 units (Appendix B).
Apartment oversupply is even more pronounced in markets across the Sunbelt region of the country, where supply is expanding at a rate of 5-10% annually—the highest pace since the 1980s. The good news is that demand there is also expanding strongly (although still lagging supply) and that the current pace of permits and starts suggests a substantial drop in completions after 2025, which should help fundamentals in those markets start recovering relatively soon. Broader housing supply shortage in these markets should help their apartment segments recover faster once their current apartment pipelines are fully absorbed.
Finally, persistent housing shortage is also a reminder to evaluate scenarios where longer-run inflation ends up higher-than-the-baseline expectation (where it stays close to the Federal Reserve’s target of 2%), which could also mean that interest rates do also stay higher for longer. One of the major lessons macro-economists have learned by now is that “housing is the business cycle,”[5] or at least one of its key components, and housing requires a lot more of the right kind of capital investment (both private and public) to keep the overall system functioning well.
NEW: SUMMIT #17

+ EDITOR’S NOTE
+ ALL ARTICLES
+ PAST ISSUES
+ LEADERSHIP
+ POLICIES
+ GUIDELINES
+ MEDIA KIT
+ CONTACT
WHERE ARE WE IN THE CYCLE?: OVERVIEW OF THE US ECONOMY AND REAL ESTATE SECTOR
Richard Barkham + Jacob Cottrell | CBRE
COMPELLING OPPORTUNITIES: MAKING A CASE FOR US REAL ESTATE
Karen Martinus + Mark Fitzgerald + Max von Below | Affinius Capital
OPEN WINDOW: WHY NOW IS THE TIME TO INVEST IN COMMERCIAL REAL ESTATE
Chad Tredway + Josh Myerberg + Luigi Cerreta | JPMAM
NORMALIZING MOVEMENT: POPULATION MOVEMENTS NORMALIZING AFTER COVID-19 SHOCK
Martha Peyton + Matthew Soffair | LGIM America
CHRONIC SHORTAGE: THE US HOUSING SCARCITY WILL BE LIKELY TO PERSIST FOR SEVERAL YEARS
Gleb Nechayev | Berkshire Residential Investments
FLORIDA FOCUS: PRODUCTION INDEX BELOW 50 CURIOUSLY SIGNALS OPPORTUNITY
Rafael Aregger | Empira Group
WHOLESALE CHANGE: DEMOGRAPHIC CHANGES AND STAGNANT INVENTORY CREATE NEW OPPORTUNITIES FOR RETAIL
Stewart Rubin + Dakota Firenze | New York Life Real Estate Investors
GAME CHANGE: INFRASTRUCTURE GROWTH ACCELERATING WITH AI
Jon Treitel | CBRE Investment Management
FOR THE TREES: MASS TIMBER INTEGRATION IN INDUSTRIAL REAL ESTATE
Mary Ellen Aronow + Erin Patterson + Caroline Suarez + Cassidy Toth | Manulife Investment Management
BORDER INDUSTRIAL: INVESTING IN US/MEXICO BORDER PORT INDUSTRIAL MARKETS
Dags Chen, CFA + Lincoln Janes, CFA | Barings Real Estate
RESILIENCE AMIDST UNCERTAINTY: HOW ISRAELI AND UKRAINIAN INVESTORS ARE ADAPTING REAL ESTATE STRATEGIES DURING CONFLICT
Asaf Rosenheim | Profimex
CYBER RISK VIGILANCE: HOW REAL ESTATE DIRECTORS AND BOARDS CAN GUARD AGAINST CYBER RISK
Marie-Noëlle Brisson, FRICS, MAI + Michael Savoie, PhD | CyberReady, LLC
ALTERNATE REALTY: DIGITAL RIGHTS MANAGEMENT FOR REAL ESTATE AND AUGMENTED REALITY
Neil Mandt | Digital Rights Management + Steve Weikal | MIT Center for Real Estate
DRIVING FORCE: UNDERSTANDING SYNDICATED LOANS AND MULTI-TIERED FINANCING
Gary A. Goodman + Gregory Fennell + Jon E. Linder | Dentons
HOUSING COMPLEX: CUTTING-EDGE APARTMENTS ARE A CATALYST FOR A MORE PROFITABLE FUTURE
Alejandro Dabdoub | AOG Living
NOTES
1. The range of estimates quoted here is based on published reports by John Burns Consulting & Research, Freddie Mac, Moody’s Analytics, National Association of Home Builder (NAHB), National Association of Realtors (NAR), National Low Income Housing Coalition (NLIHC), Up for Growth, and Zillow.
2. CPS/HVS has been conducted by the Census Bureau for decades and is the main publicly available source providing estimates of households and homeownership rates on a quarterly frequency: https://www.census.gov/housing/hvs/data/histtabs.html
3. Wheaton, William and Nechayev, Gleb. “The 1998-2005 Housing ‘Bubble’ and the Current ‘Correction’: What’s Different this Time?” Journal of Real Estate Research, Vol. 30, No. 1, 2008.
4. “Growing Opportunity to Invest in Middle-Income Multifamily” Berkshire Research Viewpoint, Fall 2018.
5. Leamer, Edward. “Housing IS the Business Cycle”, Proceedings – Economic Policy Symposium – Jackson Hole, Federal Reserve Bank of Kansas City, 2007.
ABOUT THE AUTHOR
Gleb Nechayev is Head of Research and Chief Economist for Berkshire Residential Investments.
THIS ISSUE OF SUMMIT JOURNAL IS GENEROUSLY SPONSORED BY
/ EXECUTIVE SPONSOR
AOG Living is a leading fully integrated, multifamily real estate investment, construction, and property management firm headquartered in Houston, Texas. AOG Living has acquired, built, or developed more than 20,000 multifamily units with a total aggregate value of over $2.4 billion and has a growing portfolio of more than 35,000 apartment homes and 170+ properties under management throughout the nation. Learn more at aogliving.com.
/ ASSOCIATE SPONSOR

Vertically integrated owner, operator, and developer of Sunbelt multifamily. Partnering with institutions on a single-asset and programmatic basis. 28k+ units acquired and developed. 62k+ units under management. 1,500+ associates. 8 Sunbelt states. To learn more, visit hrpinvestments.com and hrpliving.com. And for more information, contact john.duckett@hrpliving.com.
/ SUPPORTING SPONSOR
Affinius Capital is an integrated institutional real estate investment firm focused on value-creation and income generation. With a 40-year track record and $64 billion in gross assets under management, Affinius has a diversified portfolio across North America and Europe providing both equity and credit to its trusted partners and on behalf of its institutional clients globally. To learn more, visit affiniuscapital.com.