Deep analysis of core versus non-core performance has been difficult, historically, because non-core data has been difficult to obtain. Now, for the first time, core and non-core performance can be tracked at the property level, providing a pathway to new strategies.
Investors in US real estate often assume that value-add and opportunistic strategies out-perform core strategies. However, fund-level data shows that non-core strategies can have a wide variety of outcomes.
Some academic studies suggest that highly leveraged core strategies may provide consistently superior risk-adjusted returns to value-add and opportunistic strategies. However, deep analysis of core versus non-core performance has been difficult to do, because non-core data has been difficult to obtain. Now, for the first, time core and non-core performance can be tracked at the property level with the MSCI database.1
FRAMING THE COMPARISON
In the wake of the COVID-19 pandemic, amidst higher inflation and elevated interest rates, real estate capital markets quickly shifted from hyper-active to moribund in many Western countries. At the same time, secular trends created massive demand shifts for commercial and residential properties.
These seismic movements occurred just as new research questioned the alignment of investors and fund managers in core and non-core funds.2 These studies compared unlevered and levered returns in public and private markets,3 analyzed the after-fee return on value-add/opportunistic strategies4 and the overall underperformance of private equity real estate funds compared to other investment products.5
With the MSCI dataset, investors can observe the performance of private equity real estate investment amidst changing capital market cycles over the last two decades. The non-core data points to a strong correlation between growth markets and value-add real estate returns.
Specifically, the data highlights the superior performance of “development strategies” in the Sunbelt and Southwest regions. However, it also reveals uneven performance of “rehabilitation/repositioning” strategies, especially in west coast markets. Finally, the review of twenty years of performance data underscores the importance of aligning investment strategies with thematic investment trends, in both the core and non-core segments.
EXPLORING THE MSCI PROPERTY INDEX DATABASE
Core and non-core are often treated as different investment strategies in real estate investment, each with distinct characteristics and benchmarks. Core strategies focus on stabilized (more than 80% leased), income-producing assets, generating returns primarily from income with low (less than 50%) leverage.
As investors ascend the risk spectrum, non-core strategies, such as repositioning/redevelopment and new development, expose investors to a different set of factors than fully leased properties. They rely more on capital appreciation earned at the residual end of the cash flow model, than steady income earned during the holding period.
The MSCI data series contains more than 2,000 non-core properties, whose returns are reported at the property level. Given the inherent characteristics of real estate as a relatively illiquid and diverse asset class, with most individual properties changing hands only once every 5-10 years, tracking non-core investment return data at the property level can be challenging.
The MSCI database contains twenty-three years of property level returns for open-end funds, separate accounts, and closed-end funds across different property life-cycle stages and geographic locations. Many core vehicles have different sleeves that allow them to pursue non-core strategies up to a prescribed limit.
Capturing and comparing non-core and core performance at the property level gives investors a rare look at how different risk-return strategies behave over time. As of year-end 2023, the MSCI US Database contained total capital value of $502 billion, which include 111 portfolios and 7,317 properties in the US that are held in open-end vehicles, separate accounts, and closed-end vehicles by professional real estate investment management entities.6
In this study, the authors used a unique database that provided both total time-weighted return indices and dis-aggregated, masked returns. Property-level style categories were based on purchase strategies, allowing for tracking non-core assets through value-add or development phases. The database also segmented returns by market/sector and geographic location, offering new insights into core vs. non-core comparisons.7
WHAT DOES THE NON-CORE DATA SHOW?
Since 1999, there have been multiple shifts in interest rate regimes, including three periods of decreasing interest rates and three periods of increasing interest rates. These interest rate shifts affect investment strategies differently.
Core real estate does very well when interest rates fall. In fact, NCREIF and MSCI data shows that it does so well, that it exceeds many of the targets set by value-add (10% to 15%) and opportunistic funds (18%+). During periods of falling interest rates, economic fundamentals are often in danger of stalling and the Federal Reserve responds with multiple stimulus strategies at once.
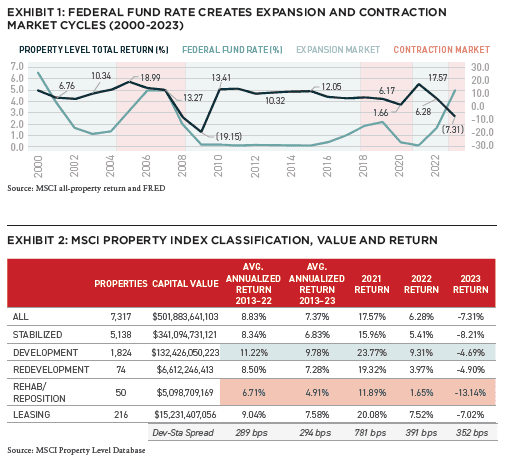
For instance, the Fed has become a major buyer of mortgage-backed securities to help support the real estate market and to keep interest rates low several times in the past twenty years (Capital Expansion Markets). Conversely, during periods of increasing interest rates, the capital markets typically experience a tightening of both equity and debt availability (Capital Contraction Markets). This phase is often accompanied by reduced liquidity and the implementation of quantitative tightening in monetary policies, aimed at restraining inflation or cooling down an overheated asset markets. The MSCI Property Index’s total return, as shown in Exhibit 1, traces big swings in the performance of private equity real estate investment over a span of years from 2000 to 2023.
The database was assembled by aggregating both core and non-core properties included in 111 portfolios owned by open-end funds, separate accounts and closed-end funds. However, users should move cautiously to form high-conviction conclusions about the performance of non-core investing with this data. Among the caveats to consider:
- Several categories of non-core performance are based on much smaller sample sizes than the core, stabilized returns.
- Leverage levels vary across both the core and non-core sample. To put the data on a like-for-like basis all returns shown here are unleveraged and shown on a pre-fee basis.
- A large portion of properties included in the database are bought and managed by “core” managers and their portfolio teams. Their non-core skills may not be as well-honed as managers who focus on value-add or opportunistic investment styles. Nevertheless, the large sample sizes shown in Exhibit 2 suggest that many core managers are well along in the process of acquiring the operating skills needed to excel at non-core investing.
- Return metrics are self-reported by managers and are not subject to full audits. This is true of nearly all private equity real estate performance data in the US. Different valuation methodologies are sometimes used for non-core properties.8
Taking into account the multiple shifts in interest rate policies over the last twenty years, what does the MSCI data show happened to core and non-core returns? When institutional real estate data is aggregated by investment style, instead of blending core and non-core properties together, (as is done in fund-level reporting), five distinct patterns emerge:
PATTERN 1: DEVELOPMENT STRATEGIES AND RELATIVE PERFORMANCE
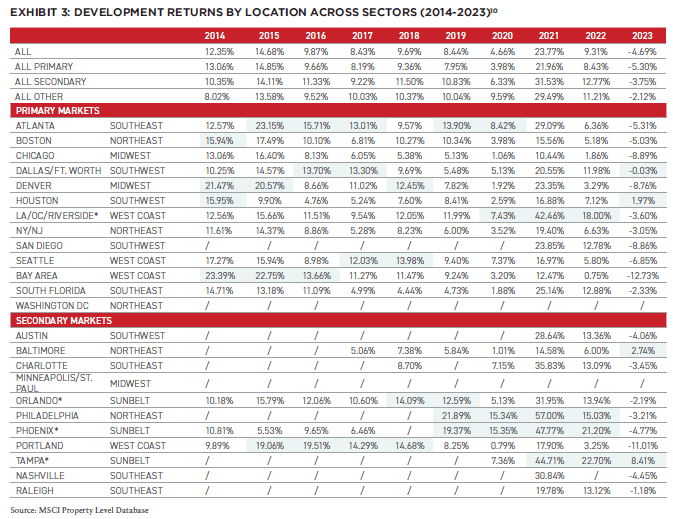
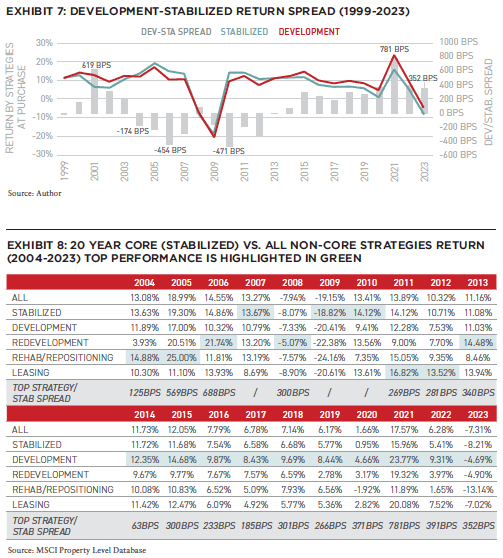
The clear “winner” among non-core strategies is the “development” category. Particularly noteworthy is the emergence of this strategy as the preeminent approach post-GFC, consistently outperforming both core and non-core counterparts from 2013 onwards. This strategy yielded an average annual return of 11.22% between 2013 and 2022, compared to the stabilized strategy’s average annual return of 8.34% over this same time period.
Deal volume also increased substantially over this same time period. When interest rates rose in 2022-23, all strategies suffered, but average development returns held up better than other strategies. Out-performance vs core held up reasonably well as shown in Exhibit 2, as the multi-year average expanded from 289BPS to 294BPS of out-performance even as values fell overall. The peak for the development strategy occurred in 2021, with a total return of 23.8%, compared to the Stabilized strategy’s total return of 15.9% in the same year, attributable to the confluence of the rapid recovery of business activities from the pandemic and a favorable capital environment with record-low interest rates, despite COVID restrictions.
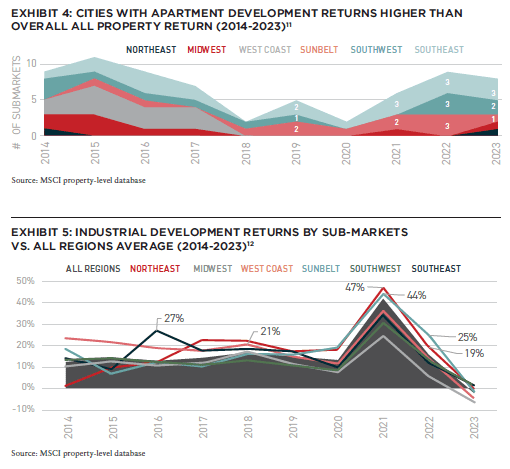
However, the outperformance of development has not been uniform across different geographic locations (Exhibit 3). According to the market segmentation data from the MSCI dataset, there is a discernible shift in the geographic component of the strategy’s overall return. Initially, the primary markets—major urban centers like New York, Los Angeles, and Chicago—were the main contributors to strong performance (2014–15). Later, out-performance shifted to secondary markets, which include smaller but growing cities like Austin and Nashville, from 2016 to 2022.
Further analysis of development strategy performance pinpoints several top-performing cities. Metros highlighted in Exhibit 3, such as Phoenix and Orlando, have consistently been among the highest-return cities for development strategies in the past 5 years. Notably, four of these five cities are classified as secondary markets, with three in the Sunbelt region, one on the West Coast, and one in the Northeast. In 2021, six out of the eight top-performing cities for development returns were located in the Sunbelt and Southwest regions.
The Sunbelt area is increasingly popular with institutional investors, thanks to rapid population growth and historically lower levels of capital investment leading to lower prices. The demand for residential properties, including single-family and multi-family rentals, condominiums, and retirement communities, has been especially strong in these Sunbelt markets.
According to MSCI database that covers 24 major sub-markets in the cities, in 2021 and 2022, 83% and 100% of sub-markets, which have apartment returns outperformed the overall average return across sectors, were from Sunbelt, Southwest and Southeast regions (Exhibit 4). In addition to the thriving residential category, the hospitality sector, featuring resorts and vacation rentals, is also gaining traction in the Sunbelt and Southwest area, catering to tourists and ‘‘snowbirds.’’
The industrial/logistics sector has also earned consistently higher overall returns. However, the biggest contributors shifted over the study period, from the West Coast and Southeast to the Northeast and Sunbelt areas. The Northeast and Sunbelt have been the only two areas that has been outperforming others since 2019, with their peak average return at 47% and 44% in 2022, respectively (Exhibit 5). In those areas, growth in the stock of logistics properties through development provided great supply-chain and transportation support for cities with sizable population or rapid growth.
Source: Author The robust performance of development strategies, therefore, can be attributed to this heightened demand for residential in the Sunbelt (Southwest and Southeast) and industrial properties in the Sunbelt and Northeast, all of which were sought-after property types among large-scale institutional investors, and many pursued a “build” versus “buy” strategy to increase their exposure.
NEW: SUMMIT #16

NOTE FROM THE EDITOR: ISSUE #16
Benjamin van Loon, CAE | AFIRE
GLOBAL CONSUMPTION: APAC DATA CENTER INVESTMENT STRATEGIES IN THE AGE OF DIGITIZATION
Michelle Lee, Eugene Seo, and Wayne Teo | CapitaLand Investment
DISTINCT VERTICALS: AI IS CHANGING THE REAL ESTATE INDUSTRY ON TWO DISTINCT PATHS
Daniel Carr and Andrew Peng | Alpaca Real Estate
DIVERGING FORTUNES: ARE COMPARISONS BETWEEN OFFICE AND RETAIL STILL WARRANTED?
Brian Biggs, CFA and Ashton Sein | Grosvenor
OCCUPYING FORCE: INSTITUTIONAL OFFICE PROPERTIES FEELING THE PAIN
Nolan Eyre, Scot Bommarito, and William Maher | RCLCO Fund Advisors
VALUE-ADD VS. CORE: COMPARING CORE AND NON-CORE STRATEGIES WITH NEW DATA
Yizhuo (Wilson) Ding | Related Midwest and Jacques Gordon, PhD | MIT Center for Real Estate
FAVORABLE CONDITIONS: STRUCTURAL CHANGES TO THE MARKET FAVOR NONBANK CRE LENDERS
Mark Fitzgerald, CFA, CAIA, and Jeff Fastov | Affinius Capital
INFRASTRUCTURE VIEWPOINT: INTEREST RATE CHANGES COULD UNLOCK NEW INFRASTRUCTURE INVESTMENTS
Tania Tsoneva | CBRE Investment Management
MISSING MIDDLE: WORKFORCE AND AFFORDABLE HOUSING IN THE US
Jack Robinson, PhD and Morgan Zollinger | Bridge Investment Group
NARROW SPACES: CHOKED STRAITS AND IMPLICATIONS FOR GDP, INFLATION, AND CRE
Stewart Rubin and Dakota Firenze | New York Life Real Estate Investors
OPCO-PROPCO OPPORTUNITY: EMERGING MODELS AND THE KEYS TO STRUCTURING PARTNERSHIPS
Paul Stanton | PTB and Donal Warde | TF Cornerstone
TRANSFORMING LUXURY: UNLOCKING VALUE IN LUXURY HOSPITALITY REAL ESTATE
Alia Peragallo | Beach Enclave and AFIRE Mentorship Fellow, 2024
SOLAR VALUATION: IS SOLAR ENERGY A VALUATION GAME-CHANGER?
David Wei and Michael Conway | SolarKal
GROUND LEVEL: THE CASE FOR GROUND LEASES AND LONG-TERM CAPITAL
Shaun Libou | Raymond James
LEGAL UPDATE / DRIVING FORCE: UNDERSTANDING SYNDICATED LOANS AND MULTI-TIERED FINANCING
Gary A. Goodman, Gregory Fennell, and Jon E. Linder | Dentons
LEGAL UPDATE / ENHANCED PROTECTION: LEVERAGING THE SAFETY ACT FOR ENHANCED LIABILITY PROTECTION IN REAL ESTATE
Andrew J. Weiner, Brian E. Finch, Aimee P. Ghosh, Samantha Sharma, and Sarah Hartman | Pillsbury
+ EDITOR’S NOTE
+ ALL ARTICLES
+ PAST ISSUES
+ LEADERSHIP
+ POLICIES
+ GUIDELINES
+ MEDIA KIT
+ CONTACT
PATTERN 2: LEASING STRATEGIES BENEFITED FROM IMPROVING MARKET AND OCCUPANCY
The returns of leasing strategies from 2004 to 2023 reveal that performance is closely linked to broader market conditions, with significant variation corresponding to economic cycles. During the years leading up to the GFC, leasing strategies experienced steady growth, peaking in 2006 with a return of 13.9%. This period of growth, characterized by favorable market conditions and high demand for leased properties, demonstrates the strategy’s responsiveness to a robust economic environment.
Compared to a typical core, stabilized strategy, a higher magnitude of losses during the GFC highlights the relatively higher risk associated with leasing strategies during the time of decreased demand and potential tenant defaults; notably, the post-GFC period showcases the resilience and recovery potential of leasing.
The years following the crisis saw a notable rebound, with leasing being the highest return strategy in 2011 and 2012, indicating a rapid recovery as market conditions improved and leasing activity increased. In 2021, the strategy witnessed a significant upturn with a return of 20.1%, which made leasing the second highest return strategy, likely benefiting from a post-pandemic recovery where demand for leased properties surged.
This performance further supports the premise that leasing strategies are indeed sensitive to recoveries from a weak fundamental market. The data from 2022, with a return of 7.49%, suggests a normalization of the market as it adapts to the post-pandemic economic landscape, but still made leasing the second highest return in that year. In 2023, leasing strategies’ return was at -7.0%, compared to -8.2% for core/stabilized and -4.7% for development.
PATTERN 3: REHABILITATION AND REPOSITIONING STRATEGIES HAVE BEEN DISAPPOINTING IN THE NEAR-TERM
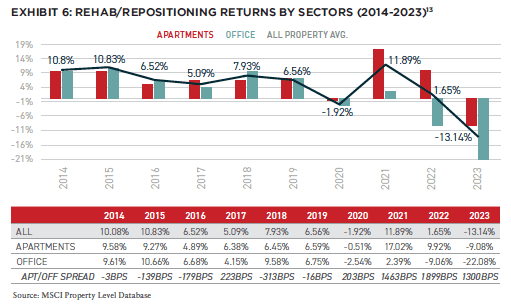
Redevelopment and rehabilitation/repositioning strategies reached their zenith in 2005, recording total returns of 20.51% and 25.00%, respectively. These figures could be attributed to the robust housing market and vigorous economic expansion during that period, which bolstered the profitability of extensive renovations and strategic property enhancements. Post-GFC, the strategies still realized commendable returns in 2011 and 2012; however, a downward trend began to emerge in 2015. At that time, primary markets were still yielding strong returns from rehabilitation/repositioning investments, but this began to wane the following year, setting off a trend of diminishing returns in these markets (Exhibit 6).
By examining the four-year period from 2020 to 2023, underperformance of these major renovation strategies becomes apparent, particularly in primary markets on the West Coast, such as San Francisco, Los Angeles, and San Diego. The reasons for this downturn could be manifold, but one plausible explanation is the substantial transformation in the office sector’s structural demand. As work formats have become increasingly flexible, the demand for traditional office space has recalibrated, impacting the viability of older, less adaptable office buildings.
The changing landscape of work, characterized by remote and hybrid models, has diminished the appeal of older office spaces that were once steady performers in primary markets. This shift has created a competitive disadvantage for aged, outdated, or underperforming office buildings, which struggle to compete against modern, newly constructed properties that cater to contemporary needs and preferences. Consequently, the lackluster performance of the rehabilitation/repositioning strategy in recent years could be symptomatic of the urban rehabilitation sector’s struggle to keep pace with these rapid changes.13, 14
PATTERN 4: STRONG, POSITIVE RETURNS EARNED BY CORE STRATEGIES WERE DRIVEN BY FALLING INTEREST RATES
In the aftermath of the GFC from 2009 to 2014, the recovery of real estate values significantly influenced the trajectory of returns.
Stabilized assets emerged as the top-performing strategy in the immediate post-crisis years of 2009 and 2010. This trend underscores the tendency for more secure, core strategies to first regain their footing as the market begins to stabilize and interest rates fell.
As the recovery took hold and the fundamental market showed gradual improvement, Leasing strategies rose to prominence in 2010 and 2011, indicating their sensitivity to improvements in market conditions and occupancy rates.
Subsequently, redevelopment took the lead in 2012, suggesting the market’s shift in focus towards strategies involving significant asset enhancement and potential for substantial value addition.
Beginning in 2015, development strategies started to dominate in terms of returns, reflecting a fully recovered market that had shifted from a state of recuperation to one of growth and expansion. This period marked the transition from a market characterized by value recovery to one driven by value creation.
Non-core strategies, known for their potential for larger value appreciation, began to be recognized by the market, underscoring the investor’’ confidence in the economic upturn and their willingness to engage with higher-risk, higher-reward investments (Exhibits 7 and 8).
PATTERN 5: CAPITAL MARKET CONDITIONS DOMINATE PERFORMANCE OUTCOMES FOR ALL STRATEGIES

Returns for all styles were generally higher during the contraction (falling interest rate) periods. They also exhibited lower volatility.
Additionally, Exhibit 6 suggests that development strategies yielded a relatively higher risk-adjusted return in both contraction and expansion capital market periods. In contrast, the rehab strategy (value-add) experienced the most significant return variation across the periods.
The leasing (core-plus) strategy maintained a relatively similar risk-return profile, while the stabilized (core) strategy was the lowest beta option, offering a reasonable, steady return throughout the periods.
A potential explanation for these patterns could be that value changes due to cap rate contraction occur in a smoother fashion, while returns in a rising cap rate period are more haphazard.
The dispersion of returns widens as NOI eventually face lease expirations and leased properties are subject to a wider dispersion of valuation adjustments. It is worth noting that development and leasing properties achieved the strongest Sharpe ratios in the capital contraction market. The lower interest rate environment in the last ten years provided development and leasing with the “double dip” of cap rate compression and step-wise improvements in NOI.
As investors and banks become more risk-adverse and cautious post GFC and post-COVID, build-to-suit, forward commitments, and pre-leasing become more common ways to earn a development premium. This reduced the risk exposure for some of the properties under development strategy.15
INSIGHTS FROM NON-CORE RETURNS
The MSCI Property Index database illustrates that development and leasing were both accretive strategies throughout the cycle. Even in 2023, where all strategies dipped into negative return territory, these two non-core strategies out-performed on a risk-adjusted basis. This is likely because secular trends, such as the growth of housing and industrial demand in the Sunbelt/Southwest, eclipsed cyclical and secular downturns in office and retail. Investing in the right thematic trend became as, or more, important than choosing specific assets.
A well-performing asset with great tenants and leases could falter if its foundation of demand declined. Development properties also “future-proof” investors and protect them from rapid obsolescence or the many uncertainties that go along with re-positioning or redeveloping older properties.
Another notable conclusion of this analysis is that the selection of investment style (core or non-core) makes a significant difference in return and volatility across different market regimes (contraction or expansion). The out-performance of development distinguishes this strategy from other non-core strategies such as leasing, rehab/renovation, and re-positioning. So, the exact type of non-core strategy matters. Finally, a metro/regional analysis of development performance suggests that thematic trends such as the growth of the warehouse sector or the rise of secondary sunbelt residential markets can out-perform traditional stabilized assets—especially in the development and leasing categories. Core fund managers would potentially benefit if their decision making expands beyond the consideration of the return and volatility differences when choosing between non-core strategies, to include predictions of thematic, macro factors. These are often more important than the core vs non-core decision, or the type of non-core strategy to pursue. The key take-away is that core fund managers ultimately decide what kind of non-core deals to pursue to get an edge in the competitive world of open-end core funds. The outcomes shown in this study indicate that these choices have been an important way to produce both positive and negative Alpha for US core funds.
—
NOTES
1. Special thanks to Elizabeth Francis and Jim Costello from MSCI for generously providing essential data critical to this research.
2. A recent study examined the correlation between superior performance and the capital market environment, including but not limited to the factors such as the prevailing interest rate environment, level of leverage, and accessibility to capital. In addition, other recent studies look at the potential for “manipulation” in real estate fund’s interim return reporting and the consequences of appraisal smoothing that shape the decision making in private equity real estate investment, such as lower volatility and risk diversification. In short, the last decade provided a very interesting backdrop for this core vs non-core comparison. See also: Thomas R. Arnold Jr., David C. Ling, and Andy Naranjo, “Private Equity Real Estate Funds: Returns, Risk Exposures, and Persistence,” Journal of Portfolio Management, May 1, 2019, https://www.reri.org/research/files/2018_arnold-ling-naranjo.pdf. Shilling, James D. and Wurtzebach, Charles, Is Value-Added and Opportunistic Real Estate Investing Beneficial? If So, Why ?. Journal of Real Estate Research, Vol. 34, No. 4, 2012, Available at SSRN: https://ssrn.com/abstract=2205191; Jackson, Blake and Ling, David C. and Naranjo, Andy, Catering and Return Manipulation in Private Equity (October 11, 2022). Available at SSRN: https://ssrn.com/abstract=4244467 or http://dx.doi.org/10.2139/ssrn.4244467; Riddiough, Timothy J., Pension Funds and Private Equity Real Estate: History, Performance, Pathologies, Risks (August 27, 2020). Available at SSRN: https://ssrn.com/abstract=3682113 or http://dx.doi.org/10.2139/ssrn.3682113.
3. Ling, David & Naranjo, Andy. (2015). Returns and Information Transmission Dynamics in Public and Private Real Estate Markets. Real Estate Economics. 43. n/a-n/a. 10.1111/1540-6229.12069.
4. Bollinger, Mitchell & Pagliari, Joseph. (2020). Practical Applications of Another Look at Private Real Estate Returns by Strategy. Practical Applications. 8. 1.11-6. 10.3905/pa.8.1.384.
5. Riddiough, Timothy J. and Li, Da, Persistently Poor Performance in Private Equity Real Estate (May 3, 2023). Available at SSRN: https://ssrn.com/abstract=4437519 or http://dx.doi.org/10.2139/ssrn.4437519
6. 75.1% were from the primary market, 12.3% were from the secondary market, and 12.6% were from the rest of the country. Geographically, 25% were from the Northeast, 10% were from the Southwest, 3% were from the Sunbelt Area, 8% were from the Midwest, 31% were from the Westcoast, 10% were from the Southeast, and 13% were from other locations.
The risk-return style is defined as the “strategy at purchase.” There are five different choices: 1) Stabilized: more than 80% occupied; 2) Leasing: standing investment purchased in the pre-leasing or lease-up phase; 3) Rehabilitation/Repositioning: standing investment purchased with the intention to undertake modest improvements using less than 25% of the purchase price; 4) Redevelopment: standing investment purchased with the intention to invest more than 25% of the purchase price to overhaul the property; 5) Development: direct funding of development. A property retains its “strategy at purchase” status until it is “sold” out of the index.
7. For instance, development or repositioning properties may be held at cost, before transitioning to the DCF (discounted cash flow) methodology of valuation once they reach stabilization.
8. The “development” category includes a wide variety of risk-return combinations including: Build to suit (fully pre-leased); projects with some pre-leasing; speculative projects with no pre-leasing; and a variety of construction risk mitigation strategies that may or may not include G-MAX construction contracts; and off-site improvement requirements by local jurisdictions. Yet, taken together, the out-performance of the development strategy is striking. Moreover, development returns are “net” of routine fees earned by the developer, but they may not include incentive fees paid to a developer for exceeding agreed-upon return targets or leasing milestones.
9. Submarkets with property count less than ten have been shown as “N/A” to minimize small sample bias.
10. Submarkets with property count less than ten have not been included in this calculation.
11. Submarkets with property count less than ten have not been included in this calculation.
12. Retail, industrial, or other sectors were omitted due to sample size less than ten.
13. It is also essential to consider the potential limitations of the sample size in representing the broader market. The dataset may have a smaller proportion of buildings that have undergone rehabilitation/repositioning strategies, leading to a sample size that may not fully capture the strategy’s returns across all private real estate investments.
14. Other possible explanations: In a tight labor market, rehab skills are harder to find than ground-up construction skills, so costs could be higher. Also, rehab and repositioning are notoriously trickier to underwrite than ground-up construction, due to the uncertainty associated with building conditions and customized approaches to retrofitting vs new construction.
15. The strategy at purchase in the database is static, which means the strategy identifier does not change along the property’s life cycle. As a result, leasing strategies enjoy most of their value improvement early in the holding period when occupancy improvements occur. Stabilized strategies are exposed to occupancy changes at all times; this asymmetry may result in lower average total returns for stabilized properties.
—
ABOUT THE AUTHORS
Yizhuo (Wilson) Ding is a Development Associate at Related Midwest/Related Companies and a former AFIRE Mentorship Fellow. He holds a MsRED from MIT and BBA from UW Madison. Jacques Gordon is the Senior Executive in Residence at the MIT Center for Real Estate. He earned a PhD from MIT, a Masters from LSE, and a BA from U Penn.
—
THIS ISSUE OF SUMMIT JOURNAL IS GENEROUSLY SPONSORED BY

Leverage the only investment management suite that automates complex processes and ensures transparency from investor to asset operations, integrating investment and debt management, capital raising, investment, financial, and operational metrics through a branded investor portal. Learn more.