A confluence of factors is creating one of the best lending environments since the post-GFC era, but changes in the competitive structure of the market will have a more dramatic impact over time.
Favorable lending conditions for nonbank commercial real estate lenders have emerged from a confluence of cyclical and structural tailwinds:
- Changes in risk-based capital (RBC) rules for banks are creating two primary impacts:
- Reducing CRE debt appetite in general, due to higher capital requirements, particularly for high volatility commercial real estate (HVCRE)
- Motivating banks to make loans to nonbank lenders, rather than directly to borrowers. This strategy can be profitable, even at tighter credit spreads, due to favorable RBC treatment.
- Nonbank lenders bridge the gap between debt and equity markets, offering a distinct advantage in offering more innovative structuring of the capital stack and the asset management skills that position them to optimize returns.
A volatile economic cycle resulted in the Federal Reserve raising short-term interest rates at the fastest pace in the last forty years. Increased borrowing costs are creating pressure throughout the capital stack, particularly for floating-rate loans and loans with near-term maturities. In addition, lower property sales activity slowed the volume of loan payoffs and restricted new lending capacity.
This confluence of factors is creating what we believe is one of the best lending environments since the post-GFC era, which generated some of the highest risk-adjusted returns in real estate. That said, changes to the competitive structure of the market (e.g., the rise in market share and sustainability of nonbank lenders) will have a more dramatic impact over time.
REGULATORY IMPACTS
Since 2010, RBC rules for banks have undergone significant changes, primarily driven by the Basel III regulatory framework and additional measures introduced in response to the GFC. The key changes were higher capital requirements and stricter risk weighting for certain asset classes.1
One of the most impacted asset classes was HVCRE; this category was introduced with Basel III and includes loans that finance the acquisition, development, or construction of commercial real estate.2 While standard capital treatment of CRE loans is 100% risk weight, for HVCRE this can be increased to 150% or more, particularly for loans on properties under development or construction that do not have pre-leased or pre-sold commitments.3
On the other hand, loans to nonbank lenders, including debt funds, are assigned a risk weight based on the creditworthiness of their borrower (e.g., the debt fund) as well as the underlying assets they are financing. These loans can have a lower risk weight if the nonbank lender has a strong credit profile. For example, A- rated borrowers (or stronger) often have risk weights of 50% or below, and unrated borrowers are generally assigned a 100% risk weight. Thus, for banks, capital treatment is often more favorable to lend to a nonbank lender rather than direct CRE lending, particularly for HVCRE loans.
Increased capital requirements for banks are detrimental in that they reduce the bank’s available capital for other lending or investment opportunities, and increased provisions for losses affect profitability, which in turn influences the amount of capital generated internally through retained earnings. In addition to higher capital requirements, other factors have made lending to nonbank lenders more attractive than direct CRE lending at this point in the cycle:
- Asset management: Banks actively manage their direct loans, monitoring borrower performance and adjusting their risk assessments as necessary. This may involve more hands-on involvement in asset management, including stepping into the shoes of the borrower in the case of a loan default. In addition to higher risk-based capital charges associated with real estate owned, banks don’t have the ownership skills to effectively take title.
- Enhanced scrutiny: A higher rate of loan defaults may lead to increased scrutiny from regulators, and additional capital requirements.
Overall, these regulatory changes have made it more expensive for banks to hold certain types of riskier assets, like HVCRE, and have encouraged banks to be more selective and conservative in their lending practices. This has created opportunities for nonbank lenders to fill the gap left by traditional banks.
MARKET ENVIRONMENT
The combination of a global pandemic, geopolitical conflict, and the highest inflation in forty years has created seismic shifts in fiscal and monetary policy since early-2020. Exhibit 1 summarizes the swings in the capital markets, relative to the pre-pandemic baseline.
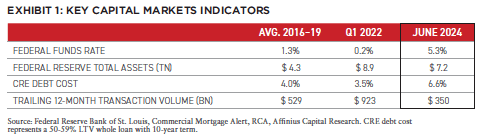
The Federal Reserve veered from historically accommodative monetary policy during the pandemic to raising rates at its quickest pace since the early 1980s while letting nearly $1.8 trillion run off the balance sheet in an attempt to battle elevated inflation.
CRE borrowing costs have more than doubled from their lows at the end of 2021, and a challenging financing environment, combined with discount rate uncertainty, led to CRE transaction volumes declining over 80% from their cyclical peak, the largest drop since the GFC.
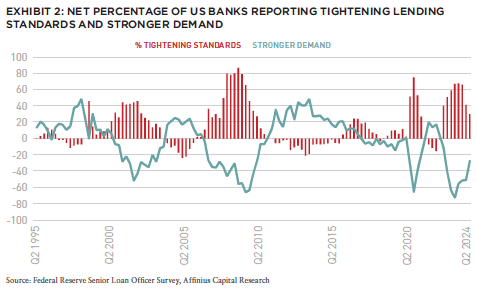
Uncertainty regarding the economy and interest rate policy has exacerbated the issue. Since early 2022, lending standards have tightened significantly, with banks showing caution similar to GFC levels. This tightening has widened the capital gap, creating opportunities for non-traditional lenders.
In addition to the challenges posed in underwriting a commercial real estate credit investment in the current environment, banks have retrenched due to balance sheet issues, including:
- Unrealized losses on investment securities. As of Q1 2024, unrealized losses on investment securities were $517 billion, having spiked following the collapse of Silicon Valley Bank in March 2023. Because of the mismatch in the duration of assets and liabilities—long-term investments, including treasury securities—declined in value with rising rates while the withdrawal or repricing of short-term funding comprised of deposits led to the evaporation of net interest margins and/or a liquidity squeeze. For context, unrealized losses are approximately seven times their previous highs since 2007.4
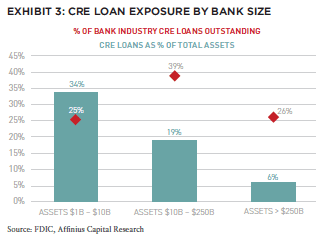
- Elevated CRE loan exposure. As shown in Exhibit 3, regional banks have higher exposure to real estate than the money center banks, and hold 39% of all bank CRE loans outstanding.5 CRE exposure played a role in the failures of Signature Bank and First Republic Bank in the first half of 2023; both were in the top ten of absolute CRE loan exposure.6 As banks sort out portfolio issues, particularly related to office lending, and experience a lack of portfolio run off, they have drawn in their horns.
The pullback in debt capital availability has not been limited to the banking sector:
- CMBS origination volumes were $39.3 billion in 2023, down 64% from $110.6 billion in 2021.7
- Life insurer commitments of $47.9 billion in 2023 were down 32% from the cyclical peak of $70 billion in 2021.8
- GSE originations in 2023 were down 37% from their 2020 peak, and 27% from their average over the previous five years.9
RELATIVE VALUE
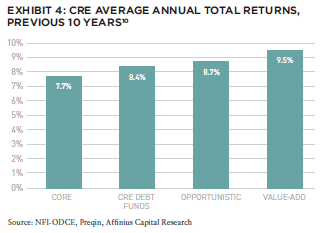
Debt funds were able to take advantage of the post-GFC dearth of credit availability and increased lending standards to produce some of the best absolute and relative performance in real estate. As shown in Exhibit 4, over the past decade, total returns for CRE debt funds have compared favorably versus other types of CRE fund investment.
While debt fund performance is generally strong over the long run, there are also cyclical factors to consider that might make relative debt fund performance more appealing in the near-term:
- In the immediate post-GFC recovery period (2010 to 2012), debt fund cumulative total returns were 38.2% (versus 31.7% for opportunistic funds) and 20.5% for value-add funds.11
- Lending spreads widen when debt capital is scarce. Since 2001, transaction volumes and lending spreads have a strong negative correlation (-0.62).12
- According to Green Street, CRE valuations are down 20% overall since early-2022, though value decreases vary by property type. Tighter lending standards provide more attractive attachment and detachment points for gap financing. The combination of lower asset values and more conservative attachment points significantly reduce the lender’s basis in the capital stack.
We expect that demand for nonbank construction lending will accelerate in 2025 as fundamentals for new product remain in favor for best-in-class assets. Non-traditional lenders are increasingly being relied upon to meet the borrowing needs of developers. Development capital needs may face additional tailwinds from the pandemic, as tenant demand is shifting across sectors and demand for certain types of new product (e.g., data centers) remains strong.
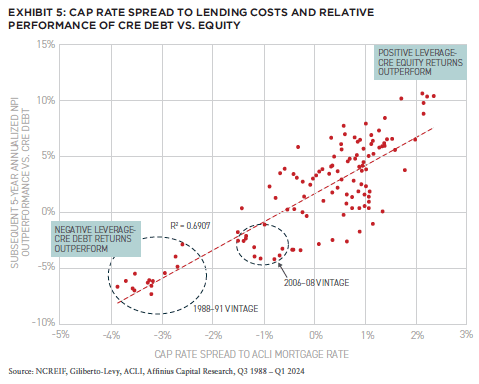
The current opportunity in debt investing is borne out by the historical relationship between NPI-implied cap rates, lending rates, and the relative performance of the NPI vs. debt.13 Higher positive leverage is strongly associated with outperformance of CRE equity over the subsequent five years, whereas negative leverage is associated with debt outperformance. The relationship is robust, with an r-squared of 0.69, as shown in Exhibit 5. Today’s spread falls between the GFC vintage and SNL crisis and suggests an elevated likelihood of outperformance of debt funds over the next few years.14
LOOKING AT THE CURRENT ENVIRONMENT
The current lending environment for nonbank CRE lenders is highly favorable. Changes in RBC rules for banks are reducing their appetite for CRE debt, particularly in high volatility areas, and incentivizing them to lend to nonbank lenders instead.
Nonbank lenders, with their unique ability to bridge the debt and equity markets, are well-positioned to capitalize on these opportunities by offering creative financing solutions. Tightening lending standards among traditional lenders and increased borrowing costs have further exacerbated the capital gap, leaving ample room for non-traditional lenders to fill the void.
With over $1.6 trillion of CRE loans maturing in the next three years and a significant portion of floating-rate loans requiring restructuring, the demand for alternative capital solutions is expected to surge.
Together, these dynamics are creating what we believe is one of the most advantageous lending environments since the post-GFC era, with nonbank lenders poised to gain significant market share and the ability to deliver strong risk-adjusted returns over time.
NEW: SUMMIT #16

NOTE FROM THE EDITOR: ISSUE #16
Benjamin van Loon, CAE | AFIRE
GLOBAL CONSUMPTION: APAC DATA CENTER INVESTMENT STRATEGIES IN THE AGE OF DIGITIZATION
Michelle Lee, Eugene Seo, and Wayne Teo | CapitaLand Investment
DISTINCT VERTICALS: AI IS CHANGING THE REAL ESTATE INDUSTRY ON TWO DISTINCT PATHS
Daniel Carr and Andrew Peng | Alpaca Real Estate
DIVERGING FORTUNES: ARE COMPARISONS BETWEEN OFFICE AND RETAIL STILL WARRANTED?
Brian Biggs, CFA and Ashton Sein | Grosvenor
OCCUPYING FORCE: INSTITUTIONAL OFFICE PROPERTIES FEELING THE PAIN
Nolan Eyre, Scot Bommarito, and William Maher | RCLCO Fund Advisors
VALUE-ADD VS. CORE: COMPARING CORE AND NON-CORE STRATEGIES WITH NEW DATA
Yizhuo (Wilson) Ding | Related Midwest and Jacques Gordon, PhD | MIT Center for Real Estate
FAVORABLE CONDITIONS: STRUCTURAL CHANGES TO THE MARKET FAVOR NONBANK CRE LENDERS
Mark Fitzgerald, CFA, CAIA, and Jeff Fastov | Affinius Capital
INFRASTRUCTURE VIEWPOINT: INTEREST RATE CHANGES COULD UNLOCK NEW INFRASTRUCTURE INVESTMENTS
Tania Tsoneva | CBRE Investment Management
MISSING MIDDLE: WORKFORCE AND AFFORDABLE HOUSING IN THE US
Jack Robinson, PhD and Morgan Zollinger | Bridge Investment Group
NARROW SPACES: CHOKED STRAITS AND IMPLICATIONS FOR GDP, INFLATION, AND CRE
Stewart Rubin and Dakota Firenze | New York Life Real Estate Investors
OPCO-PROPCO OPPORTUNITY: EMERGING MODELS AND THE KEYS TO STRUCTURING PARTNERSHIPS
Paul Stanton | PTB and Donal Warde | TF Cornerstone
TRANSFORMING LUXURY: UNLOCKING VALUE IN LUXURY HOSPITALITY REAL ESTATE
Alia Peragallo | Beach Enclave and AFIRE Mentorship Fellow, 2024
SOLAR VALUATION: IS SOLAR ENERGY A VALUATION GAME-CHANGER?
David Wei and Michael Conway | SolarKal
GROUND LEVEL: THE CASE FOR GROUND LEASES AND LONG-TERM CAPITAL
Shaun Libou | Raymond James
LEGAL UPDATE / DRIVING FORCE: UNDERSTANDING SYNDICATED LOANS AND MULTI-TIERED FINANCING
Gary A. Goodman, Gregory Fennell, and Jon E. Linder | Dentons
LEGAL UPDATE / ENHANCED PROTECTION: LEVERAGING THE SAFETY ACT FOR ENHANCED LIABILITY PROTECTION IN REAL ESTATE
Andrew J. Weiner, Brian E. Finch, Aimee P. Ghosh, Samantha Sharma, and Sarah Hartman | Pillsbury
+ EDITOR’S NOTE
+ ALL ARTICLES
+ PAST ISSUES
+ LEADERSHIP
+ POLICIES
+ GUIDELINES
+ MEDIA KIT
+ CONTACT
—
NOTES
1. Including holding more equity Tier 1 (CET1) capital as a percentage of risk-weighted assets, as well as capital conservation and countercyclical buffers.
2. Bank for International Settlements. “Basel III: International Regulatory Framework for Banks.” Last modified April 7, 2024. https://www.bis.org/bcbs/basel3.htm.
3. Based on a minimum total capital requirement of 8% under Basel III.
4. Federal Deposit Insurance Corporation; as of Q3 2023.
5. Federal Deposit Insurance Corporation; as of Q3 2023.
6. Trepp, “Q1 2023 Regional Bank Earnings: First Republic, The Cross, & Other Takeaways for CRE,” last modified May 1, 2023, https://www.trepp.com/trepptalk/q1-2023-regional-bank-earnings-first-republic-the-cross-other-takeaways-for-cre.
7. Green Street, “Commercial Mortgage Alert,” accessed August 27, 2024, https://www.greenstreet.com/news/commercial-mortgage-alert.
8. American Council of Life Insurers, “American Council of Life Insurers,” accessed August 27, 2024, https://www.acli.com/.
9. Mortgage Bankers Association, “Quarterly Commercial/Multifamily Mortgage Bankers Originations Index,” accessed August 27, 2024, https://www.mba.org/news-and-research/research-and-economics/commercial-multifamily-research/quarterly-commercial-multifamily-mortgage-bankers-originations-index.
10. Period is ten years ending Q1 2024. Core returns are NFI-ODCE net total returns. CRE debt funds, CRE value-add, and CRE opportunistic are from Preqin Private Capital Quarterly Index.
11. Preqin, “Preqin Benchmark Indices,” accessed August 27, 2024, https://www.preqin.com/data/preqin-benchmark-indices.
12. Using correlation of CRE transaction volumes from MSCI/Real Capital Analytics and lending spreads on first mortgages from ACLI.
13. NPI is NCREIF Property Index, one of the primary benchmarks for US private real estate, and calculates cap rates based on NOI and appraisals of contributed properties to the index on a quarterly basis.
14. Note there are potentially some lagged effects with the analysis as implied cap rates and fund returns are appraisal-based, but we believe the analysis to be directionally correct.
—
ABOUT THE AUTHORS
Mark Fitzgerald, CFA, CAIA, is Head of North American Research for Affinius Capital. Jeff Fastov is Co-Head of Credit Strategies for Affinius Capital.
—
THIS ISSUE OF SUMMIT JOURNAL IS GENEROUSLY SPONSORED BY

Leverage the only investment management suite that automates complex processes and ensures transparency from investor to asset operations, integrating investment and debt management, capital raising, investment, financial, and operational metrics through a branded investor portal. Learn more.