
As the commercial real estate industry continues to disambiguate post-pandemic uncertainties across all spectra, here are eleven charts to help investors map out the months ahead.
As the commercial real estate industry continues to disambiguate post-pandemic uncertainties across all spectra—political, economic, supply chain, talent, and so forth—investors find themselves in another dance between informed prognostication and everyday guesswork.
On one hand, this is an age-old investment challenge, but on the other hand, current market conditions signal a cautious CRE outlook, skewing positive, through the rest of 2024.1 (Extra emphasis on cautious).
Currently favored classes in multifamily, industrial, and even retail continue their relatively reliable performance at no great surprise, especially for those tracking adjacent trends in housing supply, supply chain realignments, and changing consumer habits—but the shadows of heightened interest rates, flattening rents, and swelling office vacancies are complicating the guesswork dance.
GLOBAL FINANCIAL HEALTH
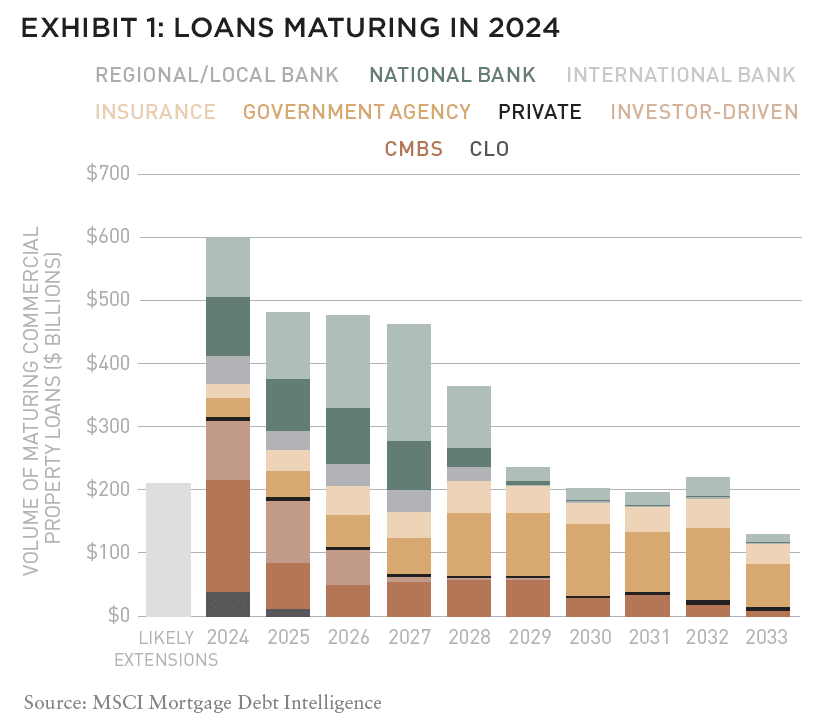
CRE writ large continues to pose a notable risk to global financial health in 2024.[i] According to the 2023 Annual Report from the Financial Stability Oversight Council, “Elevated interest rates, high costs, weakness in central business district CRE conditions, and potential structural changes in demand for office space have heightened concerns about CRE.”2 These issues are exacerbated when we account for the current scale of debt maturities, as well.
For example, as shown in Exhibit 1, roughly $820 billion3 of US commercial property loans are likely to mature in 2024, according to MSCI Mortgage Debt Intelligence as of March.4 More than 50% of the loans coming due in 2024 were provided by debt funds and CMBS lenders, who also have the largest exposure to maturing loans this year.5 And farther along the maturity schedule, MSCI notes that bank lenders are behind around 45% of the loans coming due between 2025 and 2027.
When the risks of a high-cost, high-interest environment are thus overlaid with the very real trends of maturing loans and expiring leases, and an overall weakened demand for office space, these stresses also threaten to spread beyond CRE.
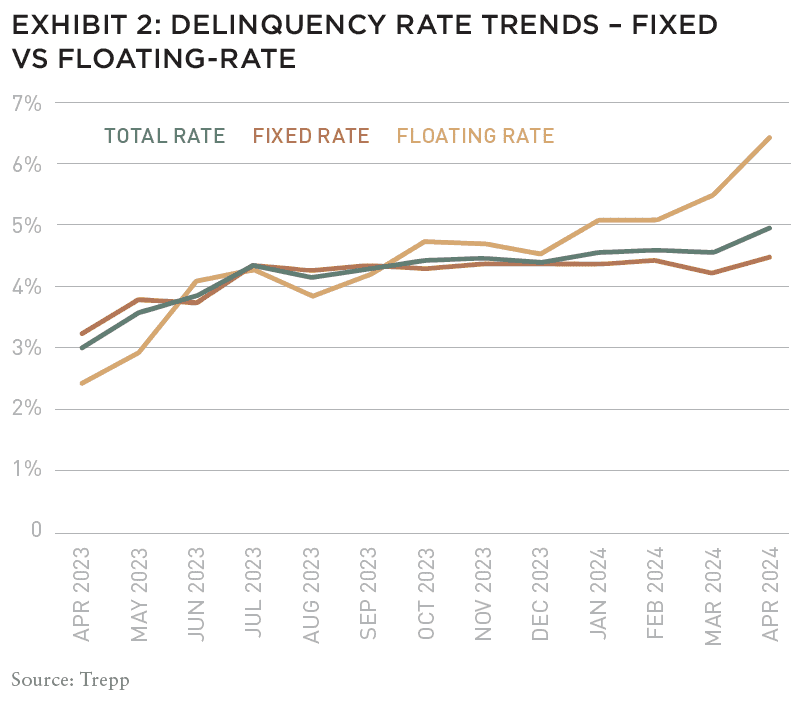
For example, as shown in Exhibit 2, the Trepp CMBS Delinquency Rate increased by 40 basis points to 5.07% as of April 2024.6 This nears the 5.35% delinquency rate reached in September 2021, during the pandemic, and has ultimately been driven by new large loans missing payments in the office, retail, and hospitality sectors. And according to Trepp, the delinquency rate for floating-rate loans increased 97 basis points to 6.61% in April, from 5.64% in March—the largest month-over-month floating delinquency rate increase in the past twelve months.
While delinquencies aren’t the final measure of financial health in CRE, their upward trend is illustrative of broader issues that extend well beyond the industry.
TRACKING CONDITIONS
The broader issues of elevated interest rates and higher costs for everything from labor to materials—compounded by structural changes in demand within the CRE space—have led regulators to recommend that investors and institutions “closely monitor” CRE exposures, track market conditions, and review contingency planning for a possibly protracted period of delinquencies.7
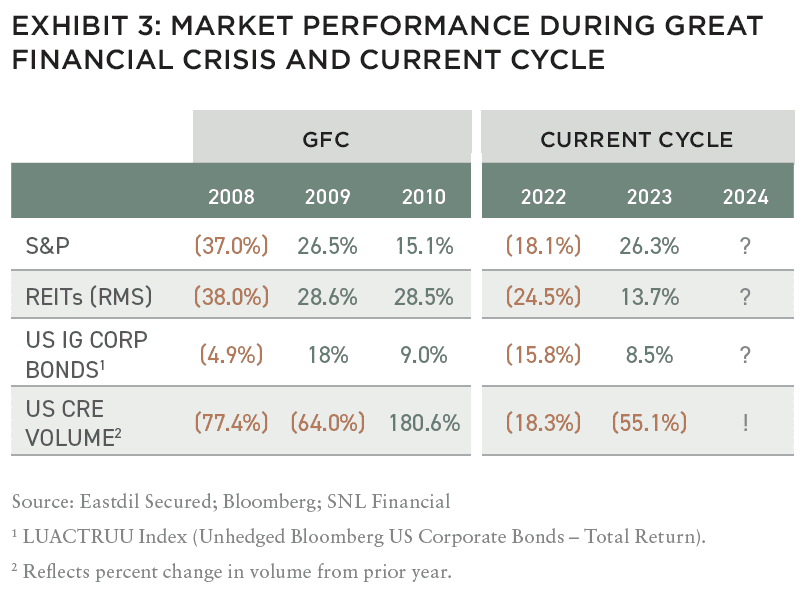
Tracking such conditions requires a broad view, starting with comparisons across various investment markets, as shown in Exhibit 3.
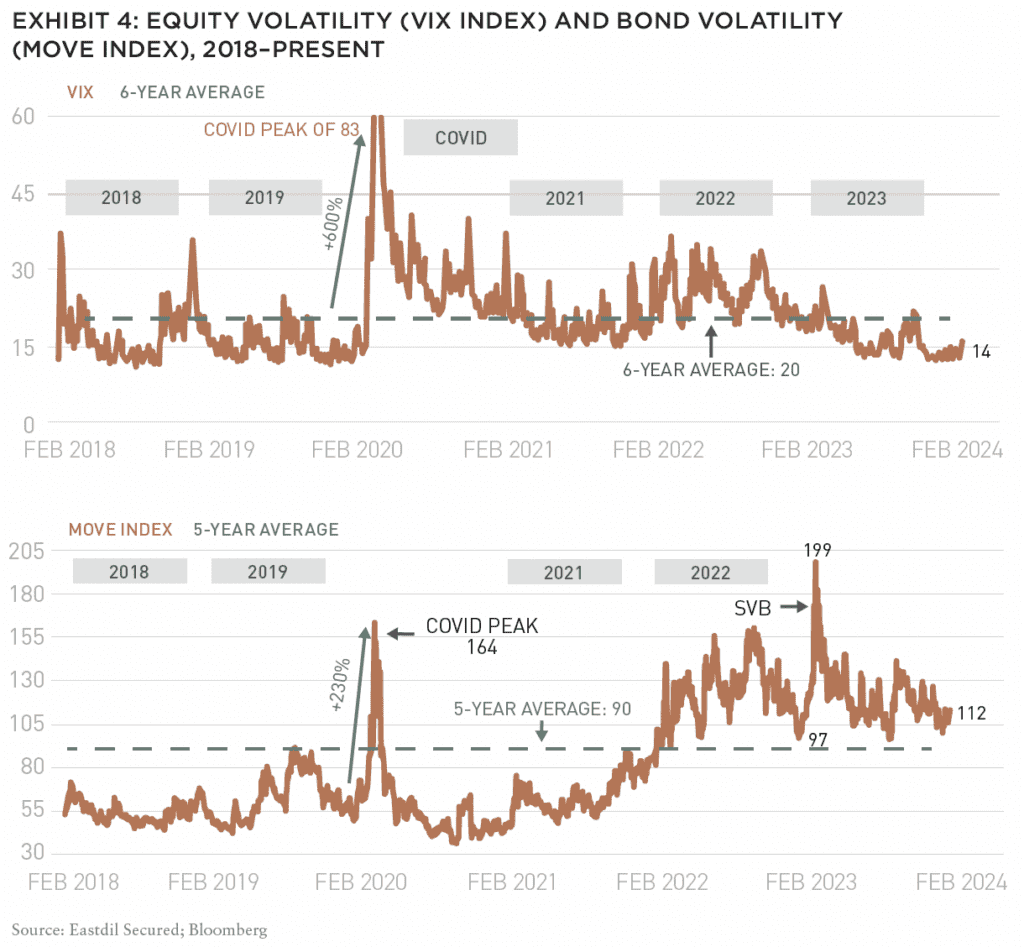
During the start of the GFC in 2008, all markets were down, and US CRE volume was down more than 77%. But by 2010, all markets bounced back, with CRE volume showing the greatest year-over-year change. In 2022, in the wake of the pandemic, all markets were down again, and by 2023, most had bounced back, except for CRE. How the numbers come back at the end of this calendar year is still a guessing game (or the hardest part of the dance, for analysts). Meanwhile, volatility in the equity market is below GFC levels, while bond market volatility remains high, as shown in Exhibit 4.
TURNING TO VALUATIONS
With general market volatility as a backdrop, it’s useful to turn to valuations in commercial real estate, which have seen significant flux and uncertainty since the pandemic.
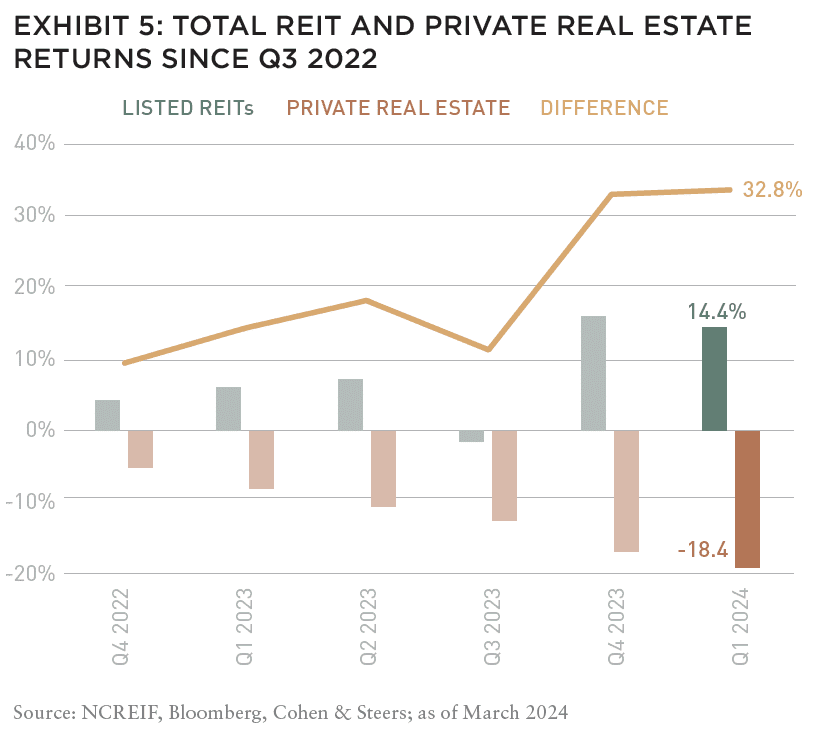
Typically interpreted with either skepticism, hope, or naivete, the comparison and contrast between listed and private real trends remains telling. On one hand, listed and private real estate tend to be correlated over the long term, but on the other hand, according to data from NCREIF, Bloomberg, and Cohen & Steers, private real estate total returns have declined for six consecutive quarters, while total returns for listed REITs have risen 14.4%, outperforming private by nearly 33% (Exhibit 5).8
The nature of real estate itself supports the general long-term correlation of returns between listed and private real estate, but according to analysis from Cohen & Steers (Exhibit 6), there is an apparently lead-lag relationship between the two types, such that “correlations between rolling one-year total returns of listed REITs and private CRE stand at just 16% since 1989.”9
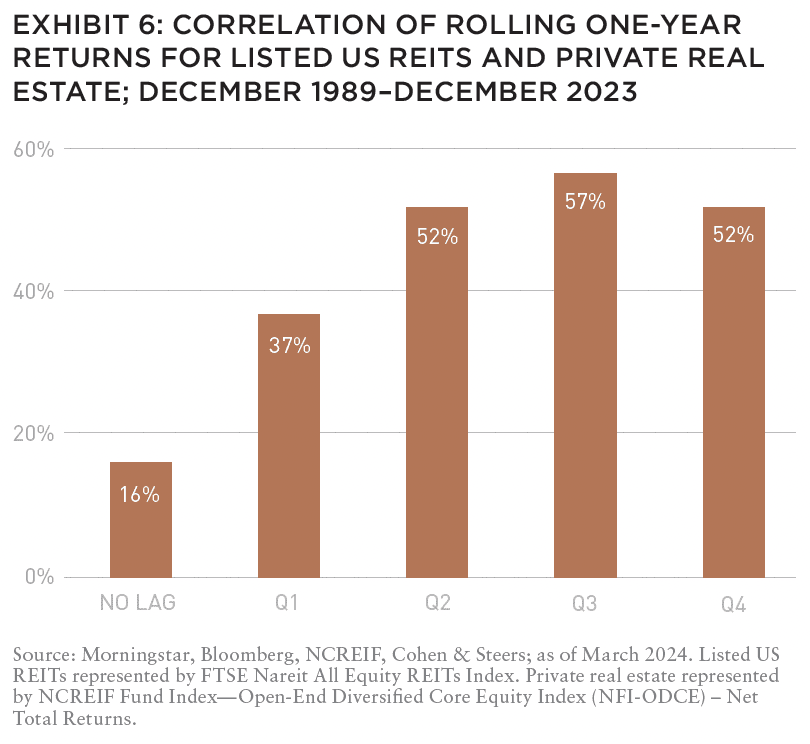
On this note, Nareit suggests that the current valuation gap between public and private real estate will “likely ensure continued REIT outperformance into 2024.”10
Additionally, in the past twenty-four years, there have been eight periods of significant REIT underperformance relative to private real estate, and only two of these periods coincided with recessions in the US. However, unlike the pandemic recession, PREA suggests that whatever recession comes next for the US, it will likely be “characterized by somewhat overreactive public markets and a scarcity of private market transactions”—the latter of which is likely to include a larger distressed portion.11
EXPLORE THE NEW ISSUE

NOTE FROM THE EDITOR: WELCOME TO #15
Benjamin van Loon | AFIRE
MID-YEAR CRE MARKET OUTLOOK: AFIRE
Benjamin van Loon and Gunnar Branson | AFIRE
MULTIFAMILY OUTLOOK: AMERICAN REALTY ADVISORS
Sabrina Unger and Britteni Lupe | American Realty Advisors
MULTIFAMILY GAP CAPITAL: BARINGS REAL ESTATE
Dags Chen, CFA and Lincoln Janes, CFA | Barings Real Estate
SINGLE-FAMILY RENTAL OUTLOOK: CERBERUS CAPITAL MANAGEMENT
Kevin Harrell | Cerberus Capital Management
SINGLE-FAMILY RENTAL SUPPLEMENT: YARDI
Paul Fiorilla | Yardi
LOGISTICS OUTLOOK: BRIDGE INVESTMENT GROUP
Jay Cornforth, Jack Robinson, PhD, Morgan Zollinger, and Cole Nukaya | Bridge Investment Group
DATA CENTER OUTLOOK: PRINCIPAL ASSET MANAGEMENT
Casey Miller and Ben Wobschall | Principal Asset Management
SELF-STORAGE OUTLOOK: HEITMAN
Zubaer Mahboob | Heitman Europe
COLD-STORAGE OUTLOOK: NEWMARK
Lisa DeNight | Newmark
OFFICE OUTLOOK: CUSHMAN & WAKEFIELD
David Smith | Cushman & Wakefield
RETAIL OUTLOOK: MADISON INTERNATIONAL REALTY
Christopher Muoio | Madison International Realty
HOSPITALITY OUTLOOK: JLL
Zach Demuth | JLL
+ LATEST ISSUE
+ ALL ARTICLES
+ PAST ISSUES
+ LEADERSHIP
+ POLICIES
+ GUIDELINES
+ MEDIA KIT (PDF)
+ CONTACT
WORKSPACE AND URBAN CENTERS
A latent prophecy of distress isn’t far off the mark. A recent example from the middle of the country serves as a synecdoche for the current state of transactions: the AT&T Center in St. Louis—one of the tallest buildings in the city at forty-four stories and 1.46 million square feet, was recently acquired by a Boston-based firm in an April 2024 auction for $3.6 million.12 This is less than 2% of the tower’s peak price of $205 million in 2006, and another price drop from the building’s last acquisition price of $4.5 million in 2022.
The various market conditions we’ve outlined in the past few pages, plus the other external economic, demographic, and political issues faced by cities in the US (and abroad) suggest that the challenges for commercial real estate, especially in urban business districts, will get worse before they get better. As suggested by members of AFIRE’s Future Trends Committee, we are facing a psychographic shift that continues to devolve the ways we work and relate to each other in work environments. This has had dramatic demand effects on how we use space, especially workspace—as illustrated by the continuous loss of value, and ongoing change of hands, experienced at the AT&T Center Tower.
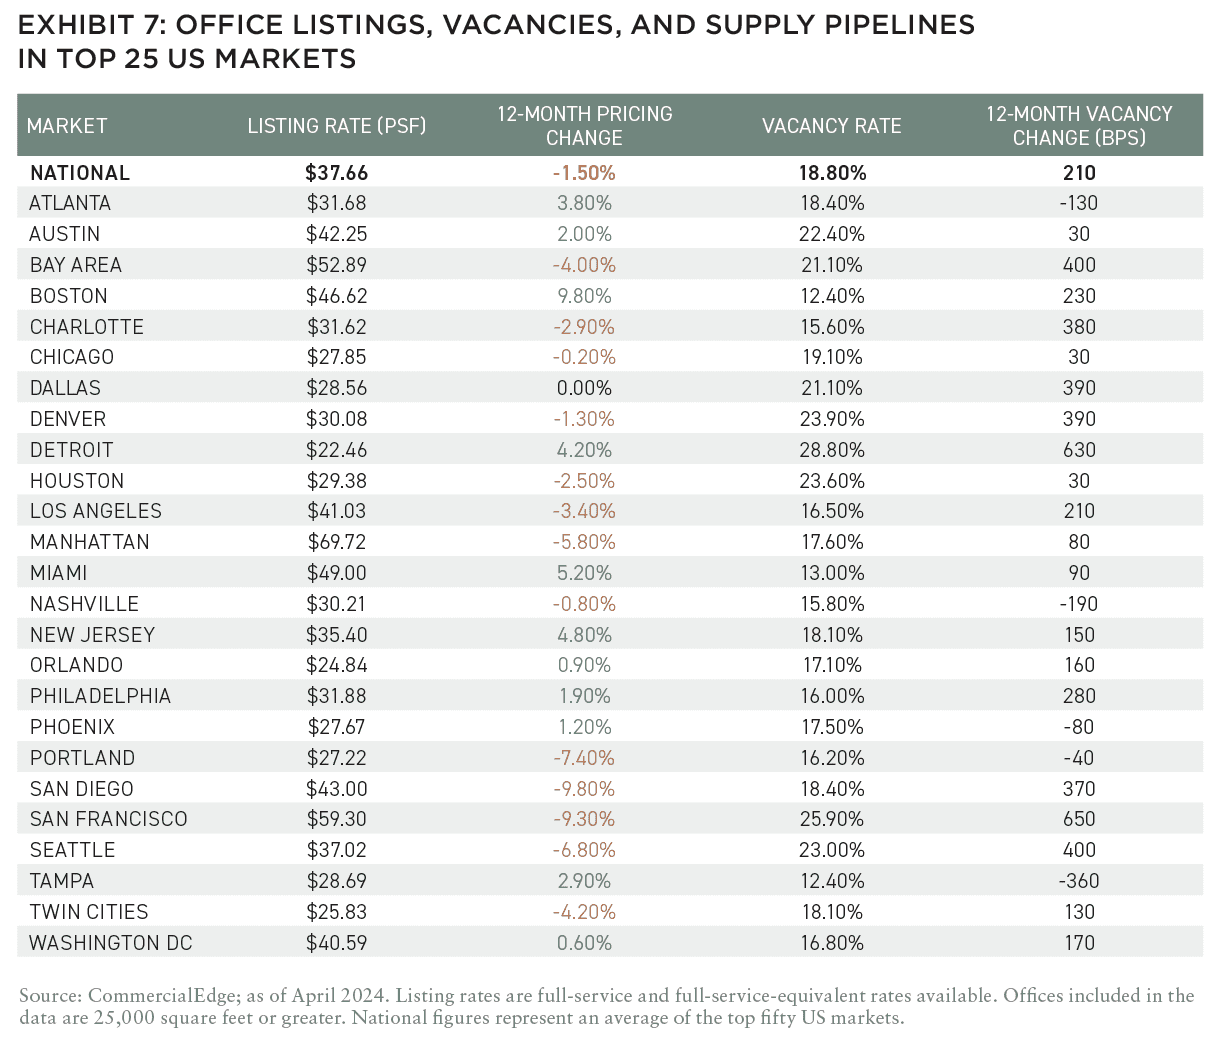
For the past few years, watchers of this psychographic shift have also been hinting at a resulting wave of office distress in commercial real estate. While that wave hasn’t yet materialized (at least, on a tsunami-scale), the May 2024 National Office Report from CommercialEdge shows that several US markets are already well-exposed to distress.13 Debt service coverage ratios (DSCRs), which measure net operating income against current debt obligations, have declined for offices in recent years, but as interest rates climbed in the past eighteen months, so too did debt costs for CRE. Cash flows have fallen, expenses have grown, and vacancies have spiked in almost every market, as shown in Exhibit 7.
According to CommercialEdge, the national average full-service equivalent listing rate was $37.66 per square foot in April 2024, representing a decrease of eight cents from March 2024, and a decrease of 1.5% from the previous year. The national vacancy rate (in the top fifty US markets) was 18.8%—an increase of 210 basis points year-over-year.
Meanwhile, approximately 83.7 million square feet of office (1.2% of stock) is under construction in the US; a shrinkage of more than 50% in the past eighteen months. And as of April 2024, only 3.2 million new square feet of space has broken ground in the US, as supply adjusts to the precipitous drop in demand.
A NEW VINTAGE
Despite the uncertainty and impossibility of knowing when the market will reach the bottom, large institutional investors are making new investments at double digit discounts from pre-2023 highs.14 Most investors express confidence that in retrospect this year will be a “good vintage,” but are hampered by their existing troubled portfolios and generalized fear.15
Facing trepidations at the coming wave of debt maturations (and potential defaults), some lenders are in “extend and pretend” mode, leading to few default salves and disincentivizing sellers to accept discounts. Buyers, on the other hand, have very little incentive to buy at (what they consider to be) inflated prices.16
If there is a conviction already that 2024 is a time for discount buys, there could be an expansion of investment activity in the second half, even if the discounts aren’t as high as they “should be,” given estimated loss in value. Rising financing costs since the Federal Reserve began instituting rate hikes March 2022 have put “downward pressure” on commercial real estate values.17 Movement by the federal reserve to reduce interest rates in the second half could provide some new momentum.
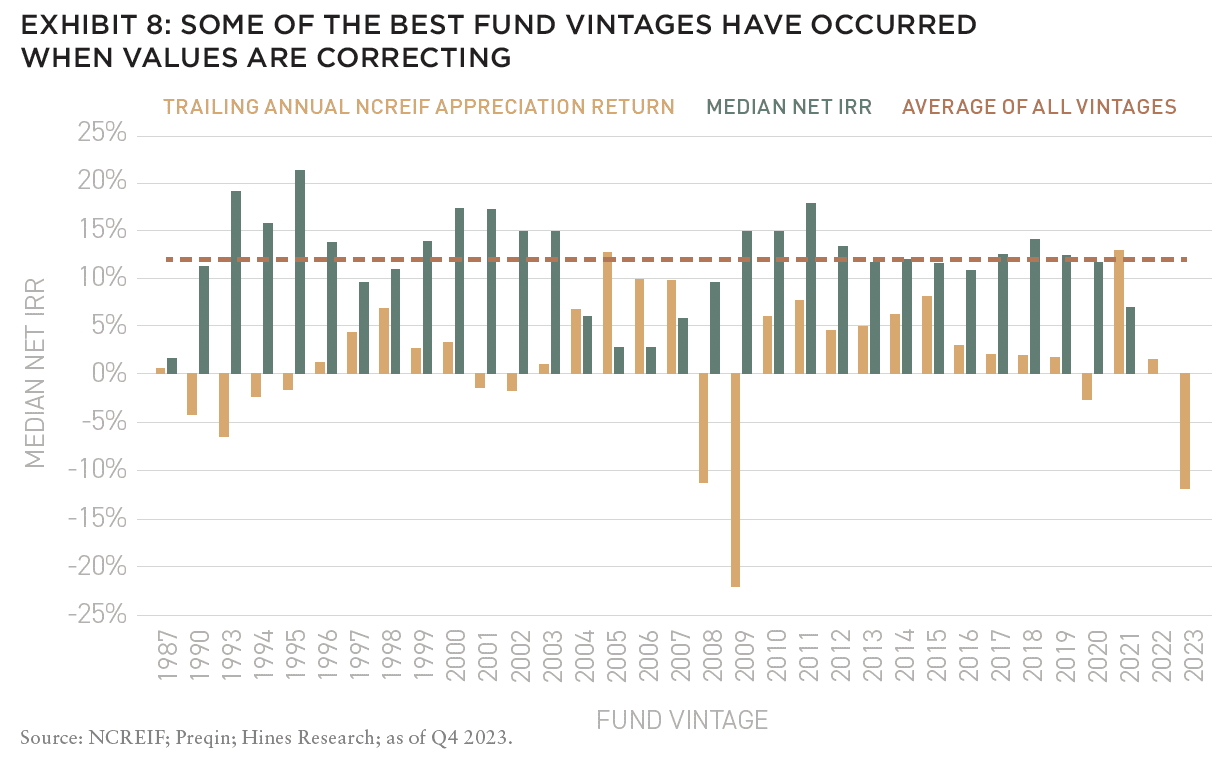
As such, there is enough information to suggest that 2024 could be a relatively strong vintage, as shown in Exhibit 8, which depicts trailing annual appreciation returns for NPI, relative to the median net internal rate of return for North American funds in each vintage year as reported by Preqin.18
WHAT’S NEXT?
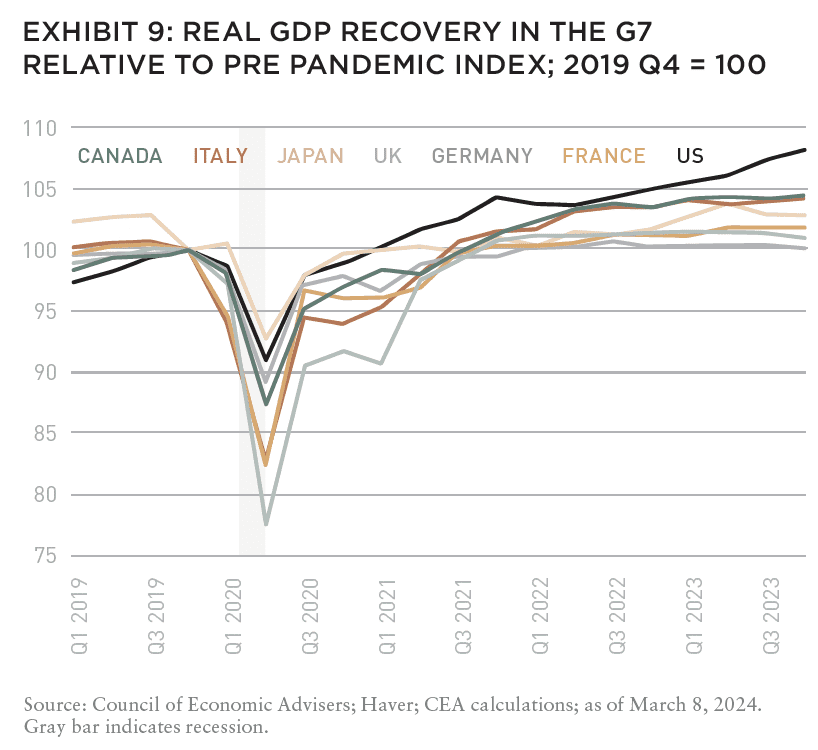
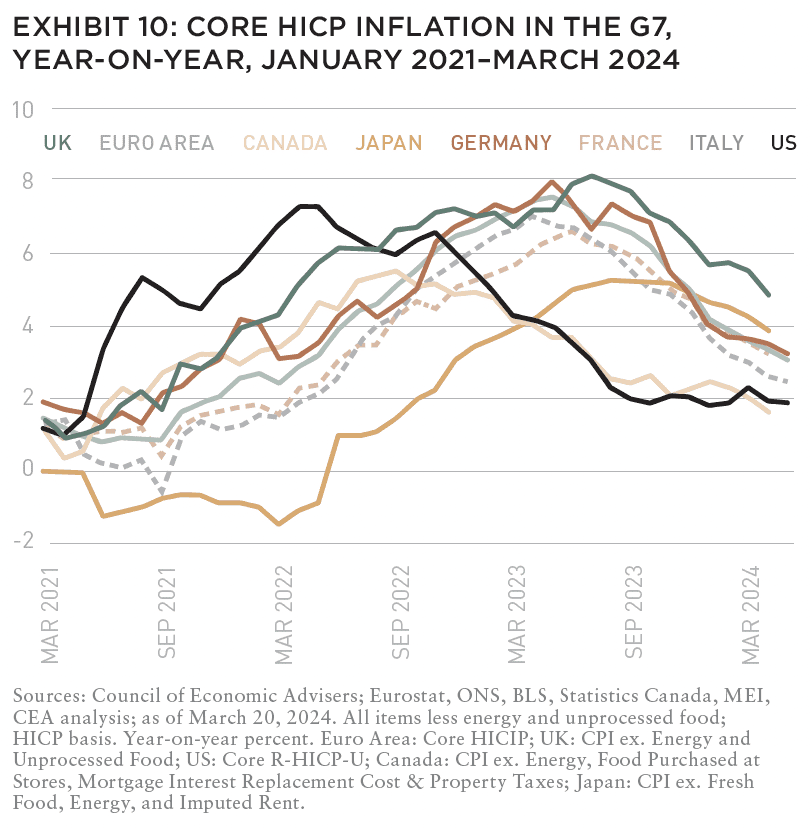
Despite its various challenges, the US economy still holds relative strength. For example, as shown in Exhibit 9, real GDP growth in the US has outpaced growth in the other G7 countries. And similarly, inflation is decelerating across these some countries—albeit at slightly different rates (Exhibit 10).
Of course, GDP and inflation data do not always reflect consumer sentiment at street level. Inflation in the US remains a sticky topic, partly because we’re in the midst of a contentious election year, and the cost of goods is a critical political metric. The supply-chain snarls that have exacerbated inflationary pressure the past few years are finally starting to normalize, and consumer demand in aggregate remains strong—but wage growth in services is easing, and consumers are becoming increasingly sensitive to pricing issues.19
Most immediately, consumers are feeling the pinch at the grocery stores and the gas pumps, but these affectations in sentiment are most pertinent in the housing sector—which, at the beginning of 2024, a majority of AFIRE members ranked as the single-most important issue in US real estate within the next five years.20
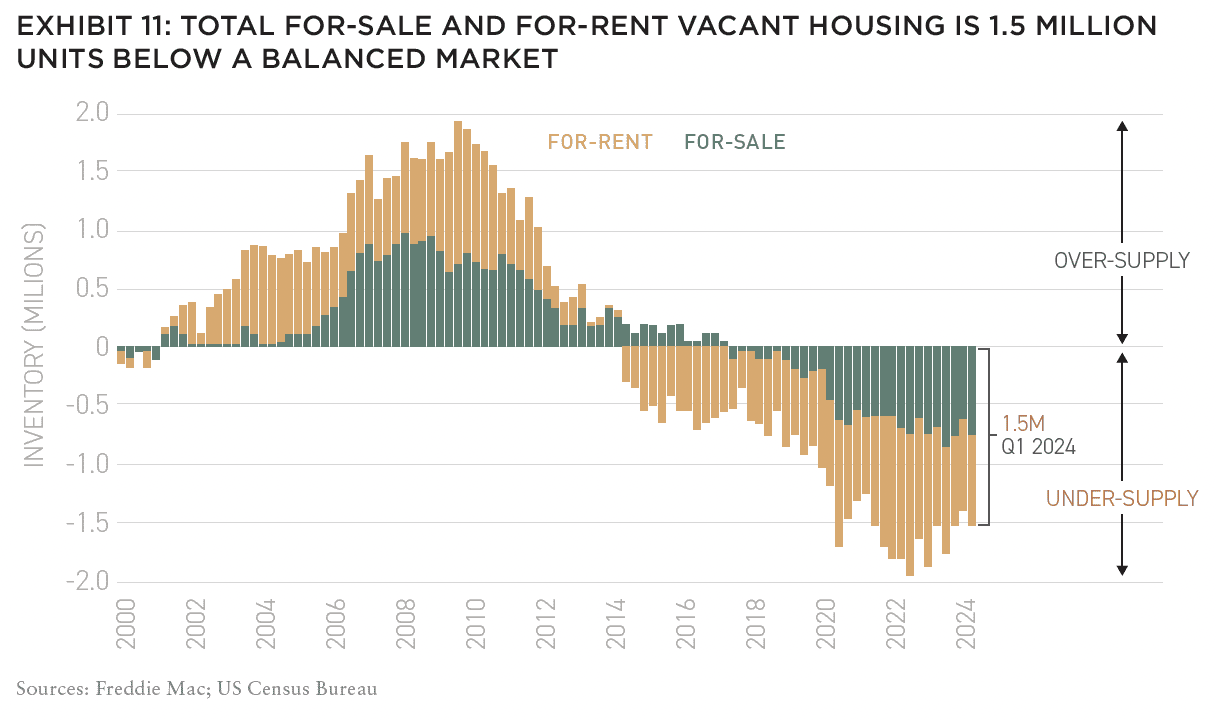
According to a May 2024 report from Freddie Mac, “tight inventory coupled with higher rates resulted in a stagnant start to the year in terms of homeownership.”21 The Q1 2024 homeownership rate of 65.6% was down from 66% in Q1 2023. Total housing stock was at 146.4 million units as of Q1 2024. Renter-occupied units increased by around one million over the last year while owner-occupied units were up around 0.6 million, and vacancy rates are relatively low—but to bring both rental and owner vacancy rates, back in line with historical averages, the US would need to add an additional 1.5 million vacant for-sale and for-rent homes (Exhibit 11).22 With the costs of capital, materials, and labor still greatly inflated, the pressure on housing markets will likely persist.
As stated by the AFIRE Future Trends Committee—and echoed by the publisher and editor of Summit— investors would do well to prioritize attention on two key issues through the rest of the year: (1) interest rates and related monetary policy and (2) the support of fact-based narratives and diplomatic, collaborative leadership across political, civic, and business contexts that can rise above the noise of political and social polarization.
By separating the signal from the noise, we can take (some of) the guesswork out of the dance.
—
NOTES
1. “2024 Midyear Commercial Real Estate Outlook | JPMorgan Chase,” n.d. https://www.jpmorgan.com/insights/real-estate/commercial-real-estate/midyear-commercial-real-estate-outlook.
2. “Financial Stability Oversight Council: Annual Report 2023.” US Treasury, 2023. Accessed May 30, 2024. https://home.treasury.gov/system/files/261/FSOC2023AnnualReport.pdf.
3. “Financial Stability Oversight Council: Annual Report 2023.” US Treasury, 2023. Accessed May 30, 2024. https://home.treasury.gov/system/files/261/FSOC2023AnnualReport.pdf.
4. This number could actually be closer to $1 trillion, according to the Mortgage Bankers Association’s 2023 Commercial Real Estate/Multifamily Survey of Loan Maturity Volumes, published February 2024. According to the report, around 20 percent ($929 billion) of the $4.7 trillion of outstanding commercial mortgages held by lenders and investors will mature in 2024, representing a 28-percent increase from the $729 billion that matured in 2023. Read more: https://internationalbanker.com/banking/commercial-real-estate-loans-a-ticking-time-bomb-for-us-banks
5. MSCI. “Wave of Property-Loan Maturities Amplified by Extensions,” n.d. https://www.msci.com/www/quick-take/wave-of-property-loan/04504358320.
6. According to MSCI, loans originated in 2021 make up the largest single vintage for 2024 loan maturities. These loans were also originated at “record-high prices and at ultra-low interest rates,” suggesting that borrowers may seek to extend their maturity dates.
7. Yue, Emily. “Drivers of CMBS Delinquency Spike in April 2024: Fixed vs. Floating-Rate Loans,” n.d. https://www.trepp.com/trepptalk/drivers-of-cmbs-delinquency-spike-in-april-2024-fixed-versus-floating-rate-loans.
8. “Financial Stability Oversight Council: Annual Report 2023.” US Treasury, 2023. Accessed May 30, 2024. https://home.treasury.gov/system/files/261/FSOC2023AnnualReport.pdf.
9. Cohen & Steers. “The Real Estate Reel: What recent listed vs. private returns mean for allocations.” May 2024. Accessed May 30, 2024. https://www.cohenandsteers.com/insights/the-real-estate-reel-what-recent-listed-vs-private-returns-mean-for-allocations/.
10. CBRE. “Performance of REITs and Private CRE is Best Correlated Over Longer Holding Periods.” May 2023. Accessed May 30, 2024. https://www.cbre.com/insights/briefs/cotw-performance-of-reits-and-private-cre-is-best-correlated-over-longer-holding-periods.
11. Pierzak, Edward F. “Mind the Gaps: Valuation Convergence and REIT Outperformance.” Nareit, February 8, 2024. https://www.reit.com/news/blog/market-commentary/mind-gaps-valuation-convergence-and-reit-outperformance.
12. Pension Real Estate Association. “Exploring the Public-Private Gap,” n.d. https://prea.org/publications/quarterly/exploring-the-public-private-gap/.
13. CoStar. “One of St. Louis’ Tallest Office Towers, Empty for Years, Sells for Less Than 2% of Its Peak Price.” April 2024. Accessed May 30, 2024. https://www.costar.com/article/642008108/one-of-st-louis-tallest-office-towers-empty-for-years-sells-for-less-than-2-of-its-peak-price.
14. “National Office Report: May 2024.” CommercialEdge. CommercialEdge, May 2024. Accessed May 30, 2024. https://www.commercialedge.com/wp-content/uploads/sites/75/2024/05/CommercialEdge-Office-National-Report-May-2024.pdf.
15. Coumarianos, John. “BREIT feels the heat but fund’s flaws are not unique.” Pro Buyer, May 10, 2024. https://citywire.com/pro-buyer/news/breit-feels-the-heat-but-fund-s-flaws-are-not-unique/a2442163.
16. Nuveen. “Real estate outlook 2024 | Investment outlook.” Nuveen, March 7, 2024. https://www.nuveen.com/global/insights/real-estate/real-estate-outlook-2024.
17. PIOnline.com. “Apartments and warehouses – today’s real estate darlings – in for a rough ride.” March 28, 2024. Accessed May 30, 2024. https://www.pionline.com/alternatives/real-estate-darlings-apartments-and-warehouses-rough-ride.
18. “No Need to Call the Bottom – Examining Fund Vintage in the US.” Hines. Hines, March 2024. Accessed May 30, 2024. https://hines-assets.s3.amazonaws.com/documents/NoNeedToCall-whitepaper-FINAL.pdf.
19. Preqin defines fund vintages as the first year that capital was called for each fund.
20. Inc.com. “Customers Are Sick of Stomaching Higher Prices, Putting Businesses in a Bind.” May 30, 2024. Accessed May 30, 2024. https://www.inc.com/ali-donaldson/customer-are-sick-of-stomaching-higher-prices-putting-businesses-in-a-bind.html.
21. “AFIRE International Investor Survey: Q1 2024 Pulse Report.” AFIRE, March 18, 2024. https://www.afire.org/survey/q12024report/.
22. Freddie Mac. “US Economic, Housing and Mortgage Market Outlook – May 2024,” n.d. https://www.freddiemac.com/research/forecast/20240516-economic-growth-moderated-start-year.
23. According to Freddie Mac: “The vacant housing undersupply metric is almost certainly a dramatic underestimate of the total housing shortage for the US. This is because this metric does not account for latent housing demand and vacant housing that is not for sale or for rent.” See also: https://www.freddiemac.com/research/insight/20210507-housing-supply
—
ABOUT THE AUTHORS
Benjamin van Loon, CAE is the Editor-in-Chief of Summit Journal. Gunnar Branson is CEO of AFIRE.
—
THIS ISSUE OF SUMMIT JOURNAL IS GENEROUSLY SPONSORED BY
Founded in 1992, Cerberus is a global leader in alternative investing with approximately $65 billion1 in assets across complementary credit, private equity, and real estate strategies. We invest across the capital structure where our integrated investment platforms and proprietary operating capabilities create an edge to improve performance and drive long-term value. Learn more.

Principal Real Estate is the dedicated real estate investment team of Principal Asset Management, the global investment solutions business for Principal Financial Group®. As a top 10 global real estate manager, with over $98 billion in assets under management and more than 60 years of experience, we provide clients with access to opportunities across both public and private equity and debt. Learn more.